No. 55, March 2014
|
|
|
|
No. 55, March 2014 |
|
|
No. 55 Are There Just Too Many of Us? What the Fall in the Current Account Deficit Reveals
|
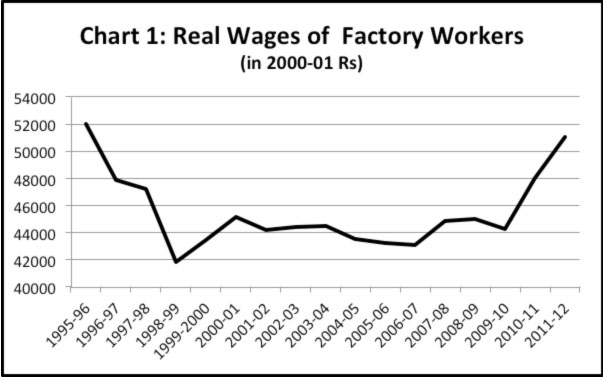
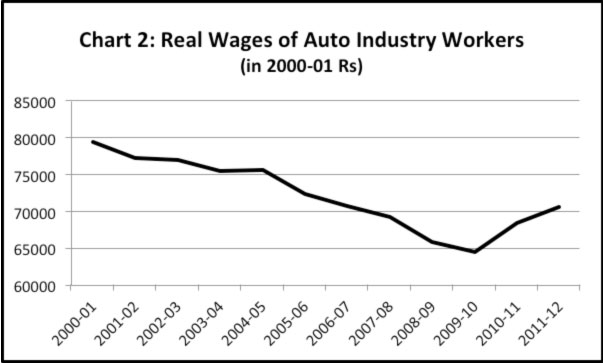
Annual Survey of Industries, 2011-12 Some rise in real wages has been achieved, through struggles of workersZ There followed a reign of management-police terror against the Maruti workers, including mass arrests and torture of workers as well as their punitive mass retrenchment. This repression continues to date, as does the struggle of the workers. Maruti was not an isolated case. Prominent factory workers’ struggles of 2013 include those waged by the workers of Hero MotoCorp, Gurgaon (January-March 2013); the powerloom industry of Ichalkaranji (January-February 2013); Mahindra & Mahindra (M&M), Nashik (March 2013); Bosch India, Bangalore (March 2013); M&M, Igatpuri (April 2013); Nokia Siemens, Chennai (June 2013); Bajaj Auto, Chakan (June 2013); Hero MotoCorp, Haridwar (September 2013); and Hero MotoCorp Gurgaon (September 2013). An important trigger for the recent wave of struggles has been relentless price rise, which has eroded the real wages of contract workers in particular, since they by and large are not compensated for dearness. Now, the data from the latest Annual Survey of Industries (2011-12) indicate that, despite the repression and hardship they had to face from the employers, workers have won clear gains through their struggles: Reversing a trend of many years, the real wages of factory workers rose by 8.5 per cent in 2010-11 and 6.3 per cent in 2011-12. Real wages of workers in the automobile industry rose by 6.3 per cent and 3 per cent in the two years.
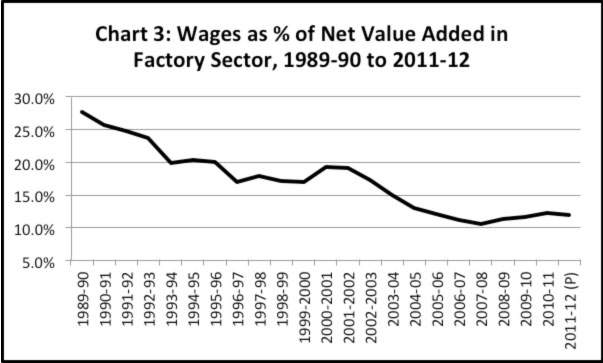
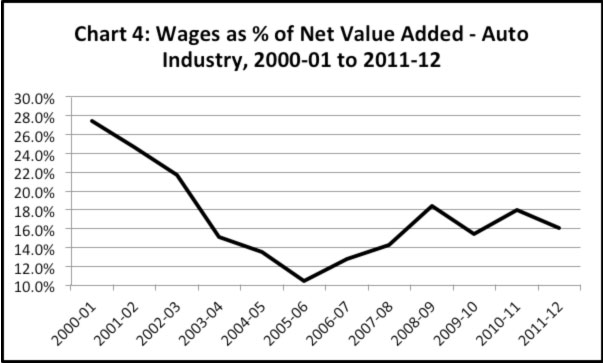
As can be seen from Charts 1 and 2, 2009-10 seems to have been the turning point. Since then real wages have staged a recovery. (We do not yet have data for 2012-13.) Signals of a downturn, however In fact, the above data indicate one reason for the unprecedented repression on the Maruti workers (148 still in jail for the last eight months on the charge of murder, over 2,000 dismissed) and the increasing aggressiveness of employers in general: Employers are trying to reverse the gains, limited though they be, won by the workers through their struggles. At any rate, the share of wages in value added is still depressed
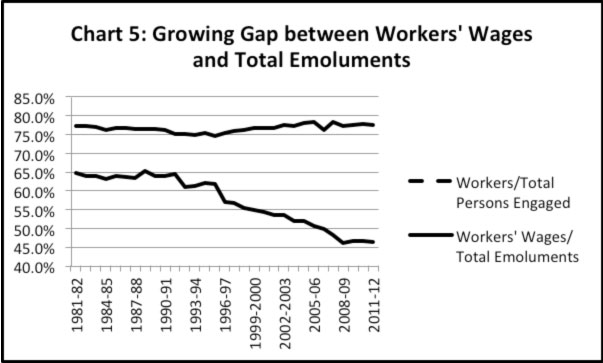
On the other hand, profit’s share in value added rose from 24.9 per cent in 2000-01 to a peak of 61.8 per cent in 2007-08. Thereafter it fell to 54 per cent in 2011-12. But the ‘culprit’ in this fall was not wages, as business interests would have us believe. As we have seen, wages’ share of value added grew only slightly in the last few years. Rather, it was interest payments that rose as a share of value added, and thus accounted for much of the reduced share of profit.4 Top management grabs a bigger share But, by contrast, the ratio of workers’ wages to ‘total emoluments’ tells a very different story. This share remained stable from 1981-82 to 1991-92, i.e., the dawn of ‘liberalisation’. Thereafter it fell steadily. From 64.8 per cent in 1991-92, it fell to 56.9 per cent in 1997-98, and further, to 48.4 per cent in 2007-08. Despite the recession, managerial pay continued to grow, and so workers’ wages as a share of total emoluments fell to 46.5 per cent by 2011-12. That is, less than half the ‘wage bill’ of industry now goes to workers. While workers’ wages got only 11.9 per cent of net value added in 2011-12, the remaining part of emoluments (i.e., ‘total emoluments’ minus workers’ wages) cornered 13.7 per cent. What accounts for this growing gap? As mentioned above, the ratio of non-production workers to production workers has not grown at all. So that cannot account for the growing share of their emoluments in the salary bill. The reason for this growing share lies elsewhere: managerial remuneration, which often includes payment to the factory owner-CEO. The growing share of value added going to profit, rent and interest has always been a visible indicator of the growing exploitation of workers. But we must include in this a growing portion of the gap between workers’ wages and total emoluments as well. (A reasonable guess of the portion cornered by the top managerial staff in the form of salaries is 7 per cent of net value added, or around Rs 60,000 crore in 2011-12 – among a relative handful of people.6 This would be quite apart from the amount they earn from their shares in these firms.)
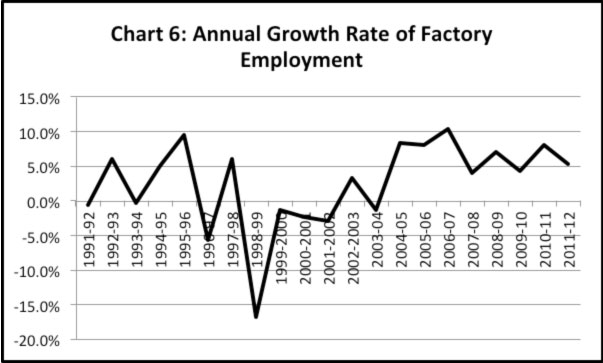
Promoting the myth of labour rigidity – to give a free hand to employers However, as brought out by Chart 6, in reality there has been considerable ‘flexibility’ – i.e., the power to throw workers out of work. Factory employment fell in 8 out of 31 years – in one year by almost 17 per cent. And it grew by over 10 per cent in a single year. Such wide fluctuations do not bear out capitalists’ loud claims of labour rigidity. Their real motive in calling for the elimination of labour laws is not to create jobs, but merely to strengthen their hands even further against the workers, and nip in the bud any attempt by workers to demand their rights. Any attempt to reduce capital-intensity in order to create more jobs will have to address very different, basic questions – throwing workers to the wolves will not do the job.
Notes: 1 .http://rupeindia.wordpress.com/2012/04/29/behind-the-present-wave-of-unrest-in-the-auto-sector/ (back) 2. The workers point out that they would hardly have attacked a manager who had in fact been sympathetic to them. (back) 3. “Auto sector skating on thin ice”, Business Standard, 22/10/13. (back) 4. Interest payments rose from 10.7 per cent of value added in 2007-08 to 14.4 per cent in 2011-12. (back) 5. The share of workers in total persons engaged was 77.3 per cent in 1981-82, and 77.7 per cent in 2011-12. (back) 6. If we assume that the ratio between the wage bill of production workers and that of non-production personnel remained the same as in 1991-92, total emoluments would have come to 18.4 per cent of net value added in 2011-12. Whereas, in fact, total emoluments came to 25.7 per cent of net value added. The difference, 7.3 per cent, is a reasonable guess at the size of managerial remuneration. (back) NEXT: What the Fall in the Current Account Deficit Reveals
|
|
| Home| About Us | Current Issue | Back Issues | Contact Us | |
|
|
All material © copyright 2015 by Research Unit for Political Economy |
|