No. 55, March 2014
|
|
|
|
No. 55, March 2014 |
|
|
No. 55 Are There Just Too Many of Us? What the Fall in the Current Account Deficit Reveals
|
Is Overpopulation the Planet’s Gravest Crisis? — by Manali Chakrabarti
Introduction The world’s population has crossed 7 billion and is still growing. Government and non-government institutions the world over are spending billions of dollars to address this ever-growing ‘crisis’. The population of the Indian subcontinent (India 1.23 billion, and Bangladesh 0.16 billion and Pakistan 0.18 billion) is around 1.6 billion; that is, every fifth person resides in this subcontinent. And hence much of the focus of global efforts is on the poor of the subcontinent. India is repeatedly compared with China, which, unlike us, seems to have been successful at restraining its masses from uncontrolled procreation. Some try to soften their position by using euphemistic terms in stating their objectives – such as ensuring ‘reproductive health’, or working out ‘population and development strategies’.2 Some others are blunter. The leading economist Jeffrey Sachs says: “the arrival of the 7 billionth people is cause for profound global concern.... How, in short, can we enjoy ‘sustainable development’ on a very crowded planet?... The reduction of fertility rates should be encouraged in the poorer countries as well.”3 The leading columnist Tom Friedman says simply that “the Earth is FULL”4. However they state it, the message is loud and clear: we must stop the poor from unbridled breeding which threatens the future of the species and the planet as a whole. Given that so many of the ‘best and brightest’ hold overpopulation to be the basis for all the ills of the planet, let us examine the issue at some length. Where did it all begin? Viewing this dismal state of affairs, Malthus concluded that the growth of population was to blame. He claimed that the population increased in geometric progression – 2,4,8,16,32,... while food production could increase only in arithmetic progression – 2,4,6,8,10,.. and hence at some point the population was bound to outstrip the available food In Malthus’s view, mass misery played a useful role in reducing the population and thus restoring equilibrium between population and the means of subsistence. He set out his ideas in a book, An Essay on Principles of Population (first published in 1798, and substantially revised in its 1803 edition) :
It needs to be borne in mind that Malthus was talking about the wealthiest nation of the time, which not only had the most advanced industrial production but had access to the wealth of several continents through its colonies – yet kept its working class in squalor and misery. The squalor Malthus saw was the outcome of specific historical conditions and social relations; but Malthus ignored those conditions and instead deduced from them an immutable, natural law. As soon as society generated enough subsistence for all, it would generate excess population, which would in turn be checked by the operation of the law of necessity – increased mortality due to “unwholesome occupations”, poverty, common diseases and epidemics, wars, plagues, and famine. Thus, via misery and death, population and subsistence would return to equilibrium, only to start the process all over again. (In fact, for Malthus there was no ticking ‘population bomb’ which would explode in the future: Human society was always oscillating between growth in population and the entry of ‘natural’ checks on that growth.) Hence Malthus opposed doing anything to ameliorate the conditions of the masses. Rather, he said, it was counterproductive to do so, since it would simply lead to them spawning more children; and for the same reason it was harmful to raise wages. Malthus was displeased by the efforts of doctors, who he claimed in their ignorant zeal to save lives through medicine were actually doing irreparable harm. He campaigned successfully against the existing meagre relief for the poor; partly under the influence of his tract, England’s Poor Law was amended to make it even more restrictive and harsh. The book was a massive commercial success, running into six editions. The argument was embraced wholeheartedly by the ruling classes. Both of Malthus’s propositions – regarding the growth of population and of food production -- were disproved by events. Food production per capita has grown steadily (it is not for want of food in the world, but access to it, that people starve). Moreover, contrary to Malthus’s thesis that abundance of the means of subsistence would lead to excess population growth, better-off societies tend to have slow (or even negative) population growth rates. Poorer societies, where couples fear that their children may not survive, tend to have higher population growth rates.6 Instead of finding an explanation for poverty in the prevailing historical conditions and social relations, Malthus effaced them and substituted them with a supposed natural law. It is this approach that drew such appreciation from the ruling classes of his day, and ours. Thus, despite Malthus’s theory having been empirically disproved, it refuses to go away. For example, Jeffrey Sachs explicitly cites Malthus to support his view that “excessive population growth would cut short economic progress”.7 Others unwittingly base their arguments on his theory. When George Bush claimed that growing consumption in China and India was the cause of the rise in global food prices, he was resting on the legacy of Malthus. Similarly, when the advanced countries point to rising absolute figure of current carbon emissions in countries like China and India as the threat, they deliberately efface the fact that they have been responsible for the overwhelming bulk of historical per capita emissions. From eugenics to ‘population control’
A new angle to the concern over overpopulation was provided by Charles Darwin’s cousin, Sir Francis Galton. Galton put forward the view of the “declining genetic stock of the nation” in his work Inquiries into Human Faculty and Its Development. To counter this ‘dysgenic’ trend, he proposed an active policy of ‘eugenics,’ a word he coined meaning ‘good births.’ Eugenics would encourage more children from the fit, and fewer — or no — children from the unfit, with the ultimate goal of engineering the evolutionary ascent of man. The ‘eugenics doctrine’ was wholeheartedly accepted by social reformers and academia of the time (75 per cent of colleges offered courses on eugenics in the 1920s1. Unlike Malthus (who trusted that plague, influenza, etc. would eliminate the poor), these well-meaning individuals sought a proactive programme to ensure a ‘desirable population’. They also campaigned for the intervention of the government to implement these initiatives. Even Margaret Sanger, the influential American birth control activist and sex educator who founded the ‘Planned Parenthood’ movement in 1916, voiced pro-eugenics views and at times shared platforms with the eugenicists. Sanger was a proponent of ‘negative’ eugenics, which aimed to improve human hereditary traits through social intervention by reducing reproduction by those considered ‘unfit’. Sanger’s views included advocacy of an exclusionary immigration policy, free access to birth control methods and full family planning autonomy for the able-minded and compulsory segregation or sterilization for the profoundly retarded.12 In her book The Pivot of Civilization, she advocated coercion to prevent the “undeniably feeble-minded” from procreating.13The growing influence of the American eugenicists suffered a serious setback by the rise of Nazism in the 1930s in Germany, wherein the German state introduced racially targeted social policies to establish the supremacy of the Aryan race. The central ideology of Nazism was based on eugenics, whereby classes of humans identified as “life unworthy of life” (including, but not limited to, the criminal, degenerate, dissident, feeble-minded, homosexual, idle, insane, and the weak) were slated for elimination from the chain of heredity. More than 400,000 people were forcibly sterilized while 275,000 were killed under Action T4, a ‘euthanasia’ program.14 The best known State-sponsored eugenics programme was the Holocaust, the Nazis’ attempt to wipe out entire ethnic groups (Jews, gypsies). The worldwide condemnation of Nazi policies brought eugenics into disrepute. The emphasis now shifted to ‘population control’. In 1952 John D. Rockefeller III founded The Population Council, an international non-government organisation directed at controlling the population of the poor countries. The first president of the Council appointed by Rockefeller was a eugenicist; Frederick Osborn, author of Preface to Eugenics (New York, 1940), leader of the American Eugenics Society. Today the Population Council operates in over 60 countries through its offices in Asia, Latin America and Africa. In 1969 the UNFPA (United Nations Population Fund) was set up primarily due to massive lobbying by John Rockefeller. The stated mission of the UNFPA is to “deliver a world where every pregnancy is wanted, every birth is safe, every young person's potential is fulfilled”. However, the unmistakable subtext of the UNFPA’s work is the ‘overpopulation crisis’. Its website states:
The development of ecological movement in the 1960s attributed all ills of the contemporary world – hunger, pollution, dwindling resources, waste disposal, etc. on over population. Several influential scholarly works were written at the time, including the pathbreaking work of Rachel Carson Silent Spring (1962). But the one which gained immediate popularity was Paul R. Ehrlich’s Population Bomb (1968). The book began with the statement: Closer home, forced mass sterilizations (primarily vasectomies) were carried out during the Emergency period under the birth control programme initiated by Sanjay Gandhi; the program counted 8.3 million sterilizations, up from 2.7 million the previous year.16 The defeat of the Congress in the 1977 elections ended the practice of forced vasectomies. But the use of pressure to achieve sterilizations has continued in a different form till the present times in our country, with the use of incentives and disincentives. The main targets are now women. Whereas 4.6 million women were sterilized in 2011-12 alone in India, only around 2 lakh men underwent vasectomies. Women’s sterilization in India account for around 40 per cent of sterilization carried out all over the world on women in the age group of 15 to 45 years.17 The population control brigade has received a new boost with the entry of the billionaire Bill Gates in the field of ‘philanthropy’. Gates has pledged hundreds of millions of dollars to improve access to contraception in the developing world. His father has long been involved with the eugenics group Planned Parenthood. Gates senior is co-chair of the Bill & Melinda Gates Foundation and a guiding light behind its vision and direction. The Foundation has massive operations in Africa and India. In 2009, Gates convened a secret gathering of some of America's leading billionaires to consider how their wealth could be used to slow the growth of the world's population. The gathering included David Rockefeller Jr., the patriarch of America's wealthiest dynasty, Warren Buffett and George Soros, financiers, Michael Bloomberg, the mayor of New York, and Ted Turner and Oprah Winfrey, media moguls. These members, along with Gates, have given more than £45 billion since 1996 to what they claim are philanthropic causes. According to a guest at the summit, “a consensus emerged that they would back a strategy in which population growth would be tackled as a potentially disastrous environmental, social and industrial threat.”18 Which fifth needs to be eliminated?
Table 1A: Share of Global Resources – Richest 20% and Poorest 20 %
Source: Human Development Report HDR 1998 Overview, p 2
Table 1B: Carbon Footprint19 of Countries
Source: Carbon Footprint of Nations21 As is evident from the data provided in Tables 1A, 1B and 1C, it is not the poorest fifth but the richest fifth which needs to be eliminated to make the most spectacular difference to the availability of resources. Of total private consumption, 86 per cent is being consumed by the richest 20 per cent; should they be removed the average available for the rest of the humanity would increase by over six-fold. The availability of energy and high-end food would more than double for the rest of us. By contrast, removing the poorest fifth would not even make a small dent to total availability. According to Carbon Footprint statistics the total population of China, India and Bangladesh combined (accounting for 40 per cent of population) have a smaller carbon dioxide footprint than that of US alone. Actually 7.7 per cent of the population (USA, Australia, Russian Federation and UK combined) account for 43 per cent of the total carbon footprint.
Table 1C: Some Other Consumption Distribution Patterns in Different Countries
A paper published in 2009 reviewed carbon emissions of several countries over 25 years and convincingly showed that that the places where population has been growing fastest are those in which carbon dioxide has been growing most slowly, and vice versa. Between 1980 and 2005, for example, Sub-Saharan Africa produced 18.5 per cent of the world’s population growth and just 2.4 per cent of the growth in CO2, while North America turned out 4 per cent of the extra people, but 14 per cent of the extra emissions. Sixty-three per cent of the world’s population growth happened in places with very low emissions. The paper noted: “If the life-time contribution to greenhouse gas emissions of a person added to the world’s population varies by a factor of more than 1,000 depending on the circumstances into which they are born and their life choices, it is misleading to see population growth as the driver of climate change.”29 Further, many of the emissions for which poorer countries are blamed should in fairness belong to the rich countries – for example, gas flaring by companies exporting oil from Nigeria has produced more greenhouse gases than all other sources in sub-Saharan Africa put together. Similarly for China, the very rapid growth in production from 1980 to 2005 (much of it for export) is an important underpinning for its rapid growth in CO2 emissions.30 If we must reduce population to save resources, then, it is not the poorest whose numbers would have to be reduced, but the richest. Thus, in answer to those raising the population alarm, Fred Magdoff suggests that we enforce either a ‘no-child’ or a ‘one-child’ policy on the world’s top 10 per cent; immediately introduce a 100 per cent inheritance tax on the wealthy; and lower the income of the wealthy by having a very modest maximum compensation (analogous to a minimum wage). “Following these prescriptions, we can rapidly reduce approximately half of all resource use and pollution in the world.”31 Are resources actually scarce? Population density: Food: The world produced 13 quadrillion kilo-calories (kcal) in 2010, or 5359 kcal per capita per day.34 However, since much of crop production is channeled towards livestock feed for meat production, or now towards biofuel, per capita food availability was lower, at 2790 kcal per capita per day (2006-08). Contrary to Malthusian predictions of declining food per capita, this latter figure was an increase over the 2220 kcal per capita per day in the early 1960s.35 Present projections by international bodies such as the FAO do not anticipate any difficulty in ensuring food security. While agricultural growth may be threatened in future by climate change, conversion of farmland to non-agricultural uses, or other man-made phenomena, these have nothing to do with population growth as such. According to Joshua Muldavin, a geography professor at Sarah Lawrence College who focuses on food and agricultural instruction, “We have two or three times the amount of food right now that is needed to feed the number of people in the world.”36 Emelie Peine, a professor of international politics and economy at the University of Puget Sound elaborates on the reason for food shortage: “We don't have food shortage problem, what we have is a distribution problem and an income problem.”37 In 1998, Frances Moore Lappe, Joseph Collins, and Peter Rosset, in their famous book World Hunger: Twelve Myths claimed that:
And the fact that there is more than adequate food for the world population still seems to hold true. Eric Holt Gimenez, Executive Director, Food First/Institute for Food and Development Policy, has stated that “Hunger is caused by poverty and inequality, not scarcity”. According to him,
Thus we can safely conclude the reason for global hunger is not its population – we already produce enough food for all and much more. And yet poor families and poorer nations do produce more children than the richer nations. Let us examine the reason for the same. Why do the poor have more children? Any woman who has nurtured a child in her womb for nine months, often without access to adequate diet, has undergone labour pain and then nourished the child with her own body in spite of being seriously anemic, knows better than the minister. Let us try to understand the economic reasons behind the poor having more children. Apparently, the human young need to be looked after the longest among all the species. Actually the rich and the affluent ‘children’ never ever grow up fully, and need to draw upon the wealth and connections of their parents and community to get by even when they are well into their adulthood. Most members of the elite do not need to earn a living through their own means but prefer to rely on hereditary wealth and jobs got through connections. Further they take pride in asserting that they are related to the powerful through blood relations or caste affiliations. By contrast, a child born in a poor family has to fight for life from her very first breath. A devastating report brought out by Save the Children in 2009 stated that nearly two million children under five die every year in India, one every 15 seconds – the highest number anywhere in the world. More than half die in the month after birth and 400,000 in their first 24 hours.40 In 2010, the Infant Mortality Rate41, is reported to be 47 at the national level, and varies from 51 in rural areas to 31 in urban areas.42 Further, over 20 per cent of the world’s child deaths occur in India and one in three of all malnourished children in the world live in India. A child who has severe acute malnutrition is at least nine times more likely to die than a child who does not. Around 28 per cent of child deaths are linked just to poor sanitation and unsafe drinking water.43 According to the records of Children in India 2012, a statistical appraisal by the Union Ministry of Statistics and Programme Implementation, nearly half of India's children – approximately 60 million – are underweight, 45 per cent have stunted growth (too short for their age), 20 per cent are wasted (too thin for their height, indicating acute malnutrition), 75 per cent are anaemic, and 57 per cent are deficient in Vitamin A44 Thus, unlike their rich counterparts, parents of a poor family are not even sure whether their child would survive beyond infancy. And then, almost as soon as a child from underprivileged family gets past infancy, she may be compelled to start working. Based on his seminal study on Char Goplapur village in Bangladesh, Mead Cain observes that “children of both sexes begin their economically useful lives around age 6, performing such tasks as gathering fuel, fetching water, carrying messages and caring for younger children”. Further, based on some assumptions he concludes that a male child by the age twelve years becomes a net producer and by fifteen makes a net positive contribution to the family income – i.e. earns more than consumes.45 Though the study is based on Bangladesh, scholars accept that the profile he portrays are similar in other poor countries of the world.46Census 2001 found that 12.66 million children under the age of 14 have to work to earn a living. However, the number of child labourers may be considerably higher than official data show, since child labour is not always visible: children tend to be employed in household-based units in the unorganised sector. UNICEF estimates that there are 35 million child labourers in India, accounting for 14 per cent of the children in the 5-14 age group. Estimates by non-governmental organisations, based on numbers of children out of school, put the figure at over 60 million.472001 Census data reveal that the major occupations engaging child labour include ‘Pan, Bidi & Cigarettes’ (21 per cent), ‘Construction’ (17 per cent), ‘Domestic Workers’ (15 per cent) and ‘Spinning & Weaving’ (11 per cent). Interestingly, till the age of 14, both male and female children have almost the same participation in the formal workforce, but in the 15-19 years category the number of female workers reduces to almost half that of their male counterparts. This of course does not signify that female children do not work in that age group, but rather they join the army of unpaid workers48 of our economy.49 Overall, as would be clear from the discussion so far, a child in a poor family is not merely another mouth to feed, but more likely two extra hands to work with and contribute to the family income. And a crucial contribution too, given the precarious nature of livelihood that most underprivileged families have to cope with. As revealed by the report produced by the National Commission for Enterprises in the Unorganized Sector (NCEUS), in April 2009, popularly referred to as the Arjun Sengupta report, despite many years of economic growth, 77 percent of India’s population in 2004-05 continued to live on less than Rs. 20 per day, and as much as 92 percent of India’s workforce consisted of informal/unorganised workers. Food prices have skyrocketed in the last couple of years; even staple grain has gone out of a poor man’s plate, let alone pulses and vegetables. Is it surprising that all hands of a poor family are pressed upon to contribute to merely getting square meals everyday? A cursory look into history reveals that things were not very different for the masses in the rich countries of the world in the 19th century. Family sizes were large – “(I)n Britain one-third of married women born in the early 1850s had at least seven live births; 10 to 15 per cent had ten or more children… .”50 Living conditions were desperate, as would be evident from the quote below:
Children were expected to help towards the family budget and they often worked long hours in dangerous jobs and in difficult situations for a very little wage. In the introduction of a book published in 1851 called London Labour and the London Poor the author Henry Mayhew wrote:
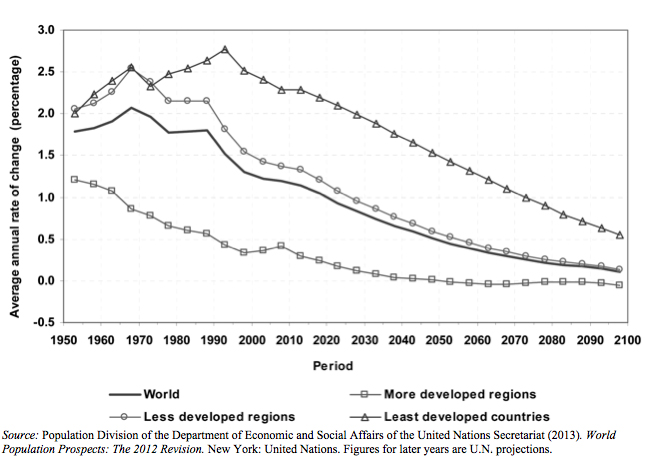
By the end of the 19th century, largely as a result of improvements in living conditions, infant mortality declined dramatically and life expectancy also increased rapidly. Concurrently, due to working class organization in the industrialized world, wages increased, working hours decreased, laws and legislations were put in place for child labour too. Work and living places became relatively sanitary and healthy, and families started getting smaller. By the turn of the 20th century a few European nations had adopted some welfare state measures mostly related to social and medical assistance, and it is interesting to note that it was introduced not with socialist agenda but to contain unionization and workers’ militancy.53 Family sizes in Europe declined rapidly thereafter: from an average of around five members at the beginning of the 20th century it declined to just over two members at the end of the 20th century.54 Closer home, in the southern state of Kerala, which houses 2.76 per cent of the country’s population, the population density is 859/sq km, three times the national average. And yet, due to better health facilities and very high literacy rates (the state has the highest literacy rate in the country at 93.91 per cent)55 and a sex ratio of 1084 (females for 1000 males) compared to the national average of 940, it has the lowest infant mortality rate of 13 (per 1000 births), comparable to the developed countries of the world. Consequently, Kerala has one of the lowest birth rates, 14.8 per 1000, which is half of the national average of 23.1. Kerala has a sub-replacement total fertility rate (TFR) at 1.7 (the replacement rate is at least 2); hence its population is likely to decline in the coming years.56 Thus one may safely conclude that fertility is not the cause of poverty but actually on the contrary poverty (and the ensuing uncertainty) is the reason for higher fertility.57 Whether or not the United Nations’ projections of future population growth rates (see Chart 1) are borne out, it is evident that population growth rates are already falling all over the world. Chart 1: Average Annual Rate of Population Change for the World and Development Groups, 1950-2100
Is there a shortage of resources? Table 4: Some Global Priorities of Expenditure
In reality the world priorities seem literally to be eliminating the poor, instead of poverty. US military spending on Iraq and Afghanistan wars so far would take care of all the basic requirements of the world. But why are the global priorities so screwed up? Let us explore the reasons. Who decides the allocation of world resources?
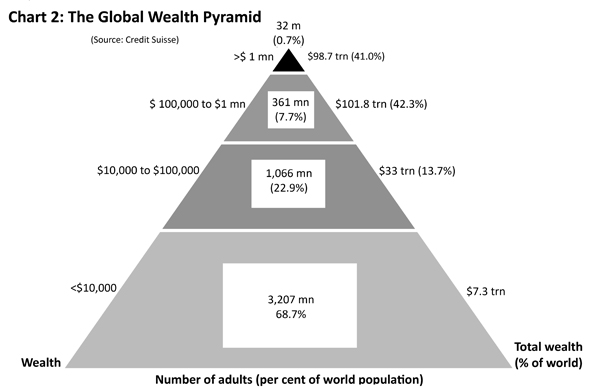
Source : Credit Suisse, Global Wealth Report 201368 The top 8.5 per cent of the people own over 83 per cent of global wealth, whereas the share of the bottom 70 per cent is barely 3 per cent. The top of the pyramid is even steeper – the net worth of the top 200 wealthiest individual (at $2.7 trillion)69 is the same as that of the bottom 3.2 billion people or half the population of the whole world! Significantly these wealthiest individuals of the world were able to increase their wealth in spite of the financial crisis. According to a recent Oxfam report, in spite of a global reduction of wealth the top 100 billionaires have been able to increase their wealth by 240 billion dollars in 2012.70 These super rich, incidentally, also include individuals who have been lobbying for reduction and control of third world population and funding major programmes towards it. The state policies and the policies of international bodies seem to be aligned with the interests of the rich and powerful. These Ultra High Net worth (UHNW)71 also wield immense political power. For this class, the seemingly wasteful expenditures listed above serve a useful purpose. The advertising drive is necessary for them to promote their products. Since they produce, among other things, beauty products, tobacco, alcohol, and entertainment/media, mass consumption of these products is useful to the owners of capital. Military expenditures enrich this class both directly (arms industries) and indirectly (by capturing/maintaining control of resources and markets, and preventing their rivals from doing so). Bail-outs are a direct transfer of State funds to their personal pockets. Hence what appears to be an irrational pattern of expenditure, in social terms, is rational in terms of ruling class interests. The First Global Census shows there are 2,170 billionaires worldwide and that the largest numbers of newly-minted billionaires are based in Asia. Since July 2012, 18 new billionaires came up in Asia followed by North America.72 With a billionaire contingent of 103, India ranks sixth among the top billionaire holding nations in the world.73 Moreover, there is a constant flow of colossal quantities of wealth from the poorest majority of the world to the richest.Capital flows from the poorest to the richest This alone amounts to nearly five times the aid budget. Thus the so-called “overseas development assistance” (ODA) never really leaves the shores of the donor nations; instead wealth, several-fold, flows in from the recipient nations. Illicit financial flows from developing countries to the richest countriesAccording to annual report of Global Financial Integrity, 2012, the developing world lost $859 billionin illicit outflows in 2010, an increase of 11 per cent over 2009. These capital outflows stem from tax evasion, corruption, crime, and other illicit activity. The developed world is the main beneficiary of these outflows. The report finds that from 2001 to 2010, developing countries lost US $5.86 trillion to illicit outflows.76 The annual illicit outflow from developing countries to the rich nations and corporations is nearly 10 times the size of the aid budget. Neo-liberal policies and losses to the developing nations Land grab by the global elite Environmental damage by corporations – a debt to the world poor Even this very incomplete list shows that the total transfer of wealth from the poorest people of the world to the most affluent, and the damage caused by the most affluent to the poorest, by the activities listed above, thus runs in to several trillions of dollars annually. This also helps explain why, in spite of vehement claims to the contrary, the chasm of economic disparity between the richest and the poorest increases over time. Conclusion From the above analysis we too have come to the conclusion that indeed the world is heading for a serious crisis, and that a section of the population is primarily responsible for it. The only difference being that it is not the bottom majority but the minuscule minority – individuals and corporate entities at the top of the wealth pyramid. And yet ironically this powerful minority blames the victims for their own excesses – the richest of the world are the main proponents of ‘overpopulation crisis’. They fund, spearhead and lobby for several large-scale programmes to contain and control the poor strata of the population. And this according to us is the biggest crisis facing the planet: ‘Too much wealth (and power, both political and military) in the hands of too few’. Global society as a whole can be best described as a plutocracy.84 Why then do the elite create such an alarm about population? As in Malthus’s time, the overpopulation theory serves a crucial ideological purpose. History has witnessed unimaginable transformations by the collective effort of common people in quest of a better world. And we can see stirrings and churning around the world – the disenchantment of the masses with the present order and their struggles against it. From the Arab spring in Tahrir Square to Bangladesh’s Shahbag Square, from the Occupy Factories movement in Argentina to the Occupy Wall Street Movement in USA, from POSCO to Maruti, Bolivia to Chattisgarh, common people are protesting, resisting, resenting and challenging the system. And despite colossal odds they are contesting the obscene disparity of ownership and private property. They are fighting for a more egalitarian world to liberate themselves from the dissipative pursuit of bare necessities, from losing precious lives to plain hunger and malnutrition, easily treatable and avoidable diseases, lack of shelter or wars of aggression. Rulers of the world have always used all the weapons in their arsenal to maintain their disproportionate appropriation of surplus and unequl wealth holding and some of their most influential weapons have been ideological weapons. Malthus’s theory of ‘overpopulation’ was essential to establish the new world order which was emerging in the 19th century. Two hundred years down, Malthus’s heirs continue to wish us to believe that people are responsible for their own misery; that there is simply not enough to go around; and to ameliorate that state of wretchedness we must not attempt to alter the ownership of social wealth and redistribute the social product, but instead focus on reducing the number of people. The struggle for a better world thus requires a struggle against such ideological weapons as well. And, at least since the French Revolution, ideology has been the most powerful weapon of the oppressed too.
Notes: 1. http://www.actionbioscience.org/environment/worldscientists.html#fullbio (back) 2. http://www.unfpa.org/issues/ (back) 3. Jeffrey Sachs, “With 7 billion on earth, a huge task before us”, http://edition.cnn.com/2011/10/17/opinion/sachs-global-population/(back) 4. http://www.nytimes.com/2011/06/08/opinion/08friedman.html?_r=0 (back) 5.Book IV, Chapter V, Essay on the Principles of Population (6th edition). (back) 6. Pakistan, Nigeria, the Philippines, Ethiopia, the Democratic Republic of the Congo, the United Republic of Tanzania, Sudan, Kenya, Uganda, Iraq, Afghanistan, Ghana, Yemen, Mozambique and Madagascar, in order of population size, account for 75 per cent of the population of high-fertility countries. -- http://esa.un.org/wpp/Other-Information/Press_Release_WPP2010.pdf (back) 7. Sachs, op. cit. (back) 8. Bellamy Foster, John 1998 ‘Malthus’ Essay on Population at Age 200: A Marxian View’ Monthly Review, Vol 50, Issue 7 (back) 9. Though as Foster noted ‘For Marx it was significant that Darwin had himself (unknowingly) refuted Malthus by means of natural history’. (back) 10. Ibid. (back) 11. Davis, Tom (2005), Sacred Work: Planned Parenthood and Its Clergy Alliances. Rutgers University Press. p. 35. (back) 12. http://en.wikipedia.org/wiki/Margaret_Sanger#cite_note-Porter.2C_Nicole_S..3B_Bothne_Nancy.3B_Leonard.2C_Jason_126-82 (back) 13. http://en.wikipedia.org/wiki/Margaret_Sanger#cite_note-84 (back) 14. Ian Kershaw, Hitler: A Profile in Power, Chapter VI, first section (London, 1991, rev. 2001) (back) 15. http://www.unfpa.org/public/about (back) 16. Carl Haub and O. P. Sharma, "India's Population Reality: Reconciling Change and Tradition," Population Bulletin (2006) 61#3 pp 3+. online (back) 17. http://www.bloomberg.com/news/2013-06-11/india-s-poorest-women-coerced-into-sterilization.html (back) 18.“Billionaire Club in a bid to curb overpopulation” http://www.thesundaytimes.co.uk/sto/news/world_news/article169829.ece (back) 19. A carbon footprint is the measure of the environmental impact of a particular individual or organization's or nation’s lifestyle or operation, measured in units of carbon dioxide. The Carbon Footprint concept focuses attention on consumption and hence provides insights into the environmental repercussions of the lifestyles of the countries in question. The UN uses the conventional inventory of emissions which focuses attention on production and hence on the performance of industry. Both factors are relevant and should be taken into account. However, the latter does not account for policies that shift emissions to other countries and account this as a success for the climate. To ensure that policies really reduce emissions of greenhouse gases, their effect on the carbon footprint needs to be calculated. (back) 20. Source: http://www.eoearth.org/view/article/150926/ (back) 21. http://carbonfootprintofnations.com/content/environmental_footprint_of_nations/ (back) 22. 1999 Human Development Report, United Nations Development Programme (back) 23. Maude Barlow, Water as Commodity - The Wrong Prescription, The Institute for Food and Development Policy, Backgrounder, Summer 2001, Vol. 7, No. 3 (back) 24. http://www.thp.org/learn_more/issues/know_your_world_facts_about_hunger_and_poverty?gclid=CMCKifWes7UCFYXc4AodQ3QAcw (back) 25. http://public.wsu.edu/~mreed/380American%20Consumption.htm (back) 26. “Rich, poor and climate change”, http://edition.cnn.com/2008/BUSINESS/02/17/eco.class/ (back) 27. The ecological footprint is a measure of human demand on the Earth's ecosystems. It represents the amount of biologically productive land and sea area necessary to supply the resources a human population consumes, and to assimilate associated waste. Using this assessment, it is possible to estimate how much of the Earth (or how many planet Earths) it would take to support humanity if everybody followed a given lifestyle. (back) 28. Living Planet Report 2012, Summary. (back) 29. David Satterthwaite, September 2009,” The implications of population growth and urbanization for climate change” Environment & Urbanization, Vol 21(2). http://cstpr.colorado.edu/students/envs_5720/satterthwaite_2009.pdf (back) 30. http://www.unfpa.org/webdav/site/global/users/schensul/public/CCPD/papers/Satterthwaite%20paper.pdf (back) 31. http://mrzine.monthlyreview.org/2012/magdoff280312.html (back) 32. See FAO, Statistical Yearbook 2013..Also see World Bank, World Development Report 2010. (back) 33. http://www.who.int/mediacentre/factsheets/fs311/en/ (back) 34. FAO Statistical Yearbook 2012, http://www.fao.org/docrep/015/i2490e/i2490e00.htm. (back) 35. Ibid. (back) 36. A hungry world: Lots of food, in too few places http://www.cnbc.com/id/100893540 (back) 37. Ibid. (back) 38. We Already Grow Enough Food For 10 Billion People -- and Still Can't End Hunger http://www.huffingtonpost.com/eric-holt-gimenez/world-hunger_b_1463429.html (back) 39. “Azad’s population control mantra: Watch late night TV”, http://www.deccanherald.com/content/13278/azads-population-control-mantra-watch.html (back) 40. http://www.guardian .co.uk/world/ 2009/oct/ 04/india- slums-children- death-rate (back) 41. Infant mortality rate (IMR) is the number of deaths of children less than one year of age per 1000 live births. The rate for a given region is the number of children dying under one year of age, divided by the number of live births during the year, multiplied by 1,000. http://en.wikipedia.org/wiki/Infant_mortality (back) 42. Children in India 2012- Ministry of Statistics and Programme Implementation, GOI http://mospi.nic.in/mospi_new/upload/Children_in_India_2012.pdf (back) 43. http://articles.timesofindia.indiatimes.com/2009-10-05/india/28104116_1_child-deaths-newborn-deaths-neonatal-diseases (back) 44. http://articles.timesofindia.indiatimes.com/2013-08-08/india/41200919_1_acute-malnutrition-silent-emergency-world-bank-report (back) 45. Cain Mead T. The economic activities of children in a village in Bangladesh. Population and Development Review. 1977;3(3):201–227., p212 (back) 46. Cockburn John, 2002, Income contribution of child work in rural Ethiopia, p 2 http://www.csae.ox.ac.uk/workingpapers/pdfs/2002-12text.pdf (back) 47. Jayati Ghosh, “Stolen childhood”, Frontline, November 4, 2006. (back) 48. The capitalist economy is built on the backs of unpaid, unrecognised and undervalued workers all over the world. Most of these unpaid workers are women and most of the unpaid work takes place in the home. Domestic labour does two things: It reproduces humans -- labour power-- and it prepares and maintains workers to go to work daily. According to the Human Development Report 1995, Gender and Human Development, UNDP, accounting for unpaid labour would increase the global output by 70 per cent, or by approximately $50 trillion in present value. (back) 49. Chakrabarti, Manali ‘Capitalism has no free lunches’ in Alternate Economic Survey, 2012-13, p 167. (back) 50. Davidoff, Leonore, Thicker than Water: Siblings and Their Relations, 1780-1920, 2012, p. 79. (back) 51. Kellow Chesney, The Victorian Underworld , 1972, cited in http://www.hiddenlives.org.uk/articles/poverty.html (back) 52. Henry Mayhew, London Labour and the London Poor, 1985, cited in http://www.hiddenlives.org.uk/articles/poverty.html (back) 53. http://www.nybooks.com/articles/archives/2013/apr/25/vichy-lives-in-a-way/#fnr-3 (back) 54. Tomka, Bella A Social History of Twentieth-Century Europe, Routledge, 2013. (back) 55. http://www.censusindia.gov.in/ accessed on 5/01/2014 (back) 56. http://articles.timesofindia.indiatimes.com/2012-02-15/india/31062819_1_population-stabilization-world-population-tfr (back) 57. The present discussion cannot adequately touch upon the other important socio-political reasons for higher fertility emerging out of gender inequality and patriarchy. (back) 58. http://www.thebeautycompany.co/downloads/Beyer_BeautyNumbers.pdf (back) 59. http://www.bat.com/ar/2011/media/downloads/BAT_Global%20market%20overview.pdf (back) 60. http://www.reuters.com/article/2011/02/01/idUS35437+01-Feb-2011+BW20110201 (back) 61. Chossudovsky, M. The Spoils of War: Afghanistan’s Multibillion Dollar Heroin Trade 62. http://nielsen.com/us/en/newswire/2013/global-ad-spend-grows-3.2-percent-in-2012.html (back) 63. http://www.reuters.com/article/2010/09/24/idUS161408+24-Sep-2010+BW20100924 (back) 64. http://www.pwc.com/gx/en/global-entertainment-media-outlook/data-insights.jhtml (back) 65. Iraq, Afghan wars ‘most expensive’ in US history, drained defense budget for decades http://rt.com/usa/us-wars-most-expensive-109/ and http://nationalpriorities.org/cost-of/ (back) 66. http://www.cbo.gov/sites/default/files/cbofiles/attachments/02-22-ARRA.pdf (back) 67. https://www.credit-suisse.com/ch/en/news-and-expertise/news/economy/global-trends.article.html/article/pwp/news-and-expertise/2012/10/en/global-wealth-2012-the-year-in-review.html (back) 68. Credit Suisse, Global Wealth Report 2013, http://images.smh.com.au/file/2013/10/09/4815797/cs_global_wealth_report_2013_WEB_low%2520pdf.pdf?rand=1381288140715 (back) 69. http://www.bloomberg.com/news/2012-11-01/the-world-s-200-richest-people.html (back) 70.Oxfam, The Cost of Inequality: How Wealth and Income Extremes Hurt us All http://www.oxfam.org/sites/www.oxfam.org/files/cost-of-inequality-oxfam-mb180113.pdf (back) 71. https://www.credit-suisse.com/in/en/news-and-expertise/news/economy/global-trends.article.html/article/pwp/news-and-expertise/2012/10/en/the-global-wealth-pyramid.html (back) 72. http://www.wealthx.com/articles/2013/first-global-census-shows-record-of-2170-billionaires-worldwide/ (back) 73. http://www.firstpost.com/business/india-may-boast-of-103-billionaires-but-their-worth-is-not-even-half-of-chinas-rich-1213735.html (back) 74. http://www.pambazuka.org/en/category/features/65096 (back) 75. http://www.newleftproject.org/index.php/site/print_article/aid_in_reverse_how_poor_countries_develop_rich_countries (back) 76. http://iff.gfintegrity.org/iff2012/2012report.html (back) 77. Quoted from The truth about extreme global inequality http://www.aljazeera.com/indepth/opinion/2013/04/201349124135226392.html (back) 78. http://awsassets.panda.org/downloads/lpr_2012_summary_booklet_final.pdf (back) 79. http://www.hindustantimes.com/StoryPage/Print/1137264.aspx (back) 80. http://www.frontline.in/static/html/fl2819/stories/20110923281911300.htm (back) 81. http://www.theguardian.com/environment/2010/feb/18/worlds-top-firms-environmental-damage (back) 82. Angus, Ian, and Simon Butler, What’s Causing The Environmental Crisis: 7 Billion Or 1%? http://grist.org/population/2011-10-26-is-the-environmental-crisis-caused-by-7-billion-or-the-1-percent (back) 83. http://edition.cnn.com/2008/BUSINESS/02/17/eco.class/ (back) 84. A society or a system ruled and dominated by the small minority of the wealthiest citizens. http://en.wikipedia.org/wiki/Plutocracy (back)
NEXT: Industrial Wages: An Update
|
||||||||||||||||||||||||||||||||||||||||||||||||||||||||||||||||||||||||||||||||||||||||||||||||||||||
|
| Home| About Us | Current Issue | Back Issues | Contact Us | |
|||||||||||||||||||||||||||||||||||||||||||||||||||||||||||||||||||||||||||||||||||||||||||||||||||||||
|
All material © copyright 2015 by Research Unit for Political Economy |
|||||||||||||||||||||||||||||||||||||||||||||||||||||||||||||||||||||||||||||||||||||||||||||||||||||||