All the official reports agree: Agriculture has done well in the past two years of the pandemic, even as other sectors suffered. “Agriculture sector has remained the silver lining”, said the Economic Survey 2020-21:
The resilience of India’s agriculture sector can be seen from the fact that despite the COVID-19 pandemic, its performance in output was strong… Rural demand has remained resilient empowered by the government’s thrust on the rural economy and infrastructure in previous years… While the difficulties created by COVID induced lockdowns adversely affected the performance of the non-agricultural sectors, the agriculture sector came up with a robust growth rate of 3.4 per cent at constant prices during 2020-21.
This continued in 2021-22. The Economic Survey 2021-22 declared that “Agriculture and allied sectors have been the least impacted by the pandemic”, and credited their “buoyant growth in the past two years” partly to Government policies.
Indeed, as the rest of the economy shrank in 2020-21, agriculture’s share of the economy jumped (see Chart 1).
Moreover, agricultural exports grew 42 per cent in two years – from $35 billion in 2019-20 to $42 billion in 2020-21 to $50 billion in 2021-22 (see Chart 2).
Chart 2: Agricultural Exports (including plantation and marine exports)
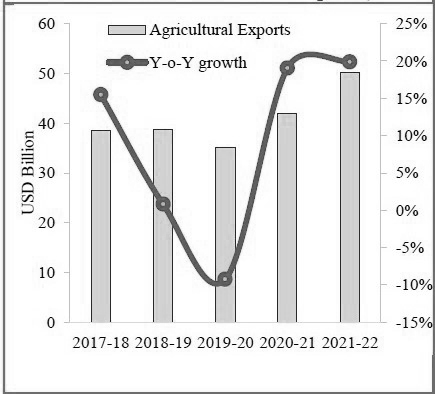
Source: Finance Ministry, Monthly Economic Report, April 2022.
We are told that another good year for agriculture is in the offing: The latest Monthly Economic Report of the Finance Ministry (April 2022) says that
In FY 2022-23 as well, growth is evident with food grain production in the ongoing Rabi season estimated to grow at 1.2 per cent over the previous year. With wholesale prices of Rabi crops like wheat, jowar, maize and rapeseed also ruling well above their previous year levels, earnings of farmers are likely to be higher in FY 2022-23.
One would have expected that this growth in production would translate into better incomes for peasants and rural labourers, and buoyant rural demand for goods. Instead there is a marked deterioration.
(1) The terms of trade for peasants – i.e., the price of their output vs the price of their expenditures – appear to have worsened in 2021-22.
(2) The income per person employed in agriculture fell in both 2019-20 and 2020-21 (after which we do not have data as yet).
(3) Real rural wages (i.e., after discounting for inflation) fell in 2021-22, and are lower than they were three years earlier. These are the wages of the section at the very bottom of India’s social pyramid, at the level of mere subsistence.
(4) In a desperate hunt for ways to earn income to meet consumption expenditure, large numbers of women joined the workforce as unpaid helpers on family farms. Moreover, high numbers of workers continue to demand MGNREGS work, despite its low wages.
(5) Confirming the fall in real rural incomes, the consumption of ordinary items of mass consumption has declined.
I. Decline in the Incomes of the Land-owning Peasantry
It is a sign of how anxious the rulers are to project ‘good news’ about the economy that they have hyped up the recent performance of agriculture. Inevitably, since it was the one sector that was not locked down in 2020-21, it continued to grow even as other sectors shrank. However, agricultural GDP actually grew at a normal but unspectacular pace (a little slower over the past two years than the average of the preceding eight years – see Chart 3). GDP specifically in crop agriculture grew at just 1.9 per cent in 2020-21. This is hardly an achievement to tom-tom. (Separate data for crop agriculture are not yet available for 2021-22.)
Note: Gross value added in crop agriculture, and in agriculture and allied activities.
Source: National Statistical Organisation (NSO), Provisional Estimates of GDP (May 31, 2022)
Terms of trade deteriorating
More importantly, the returns to peasants depend not only on the size of the crop but their terms of trade – the price they receive for their output vs. the costs they pay out.[1] Here the news is grim.
The terms of trade for farmers worsened between 2010-11 and 2018-19, at the same time that the economy as a whole has been slowing down. The terms of trade did improve somewhat in 2019-20, the year before the lockdown, amid a deepening industrial recession. They then dipped slightly again in 2020-21.
Source: Agricultural Statistics at a Glance 2021, Ministry of Agriculture and Farmers’ Welfare.
In the last quarter of 2020-21, the prices of non-food articles began to rise rapidly, while primary food articles slumped. The gap widened further in 2021-22. This indicates the terms of trade for farmers have deteriorated quite severely, though the official data in this respect will only become available later.[2]
Source: Wholesale Price Index.
This is further confirmed by Chart 6 below, from a Reserve Bank of India report. By the end of 2020, the prices of farm inputs (an index composed of high speed diesel, fodder, electricity, fertilisers, pesticides, and agricultural and forestry machinery) began rising steeply, much more so than the wholesale price index (WPI). By February 2022 farm input cost inflation was nearly twice the rate of overall wholesale price inflation. Facing such a steep rise in input costs, farmers’ returns would have shrunk dramatically, and so would their purchases of both consumer durables (e.g. two-wheelers and fans) and non-durables (e.g., food articles, soaps, detergents, textiles, footwear). This is confirmed by other data regarding rural demand, as we shall see later.
Chart 6: Farm Input Cost Inflation vs Overall Wholesale Price Inflation
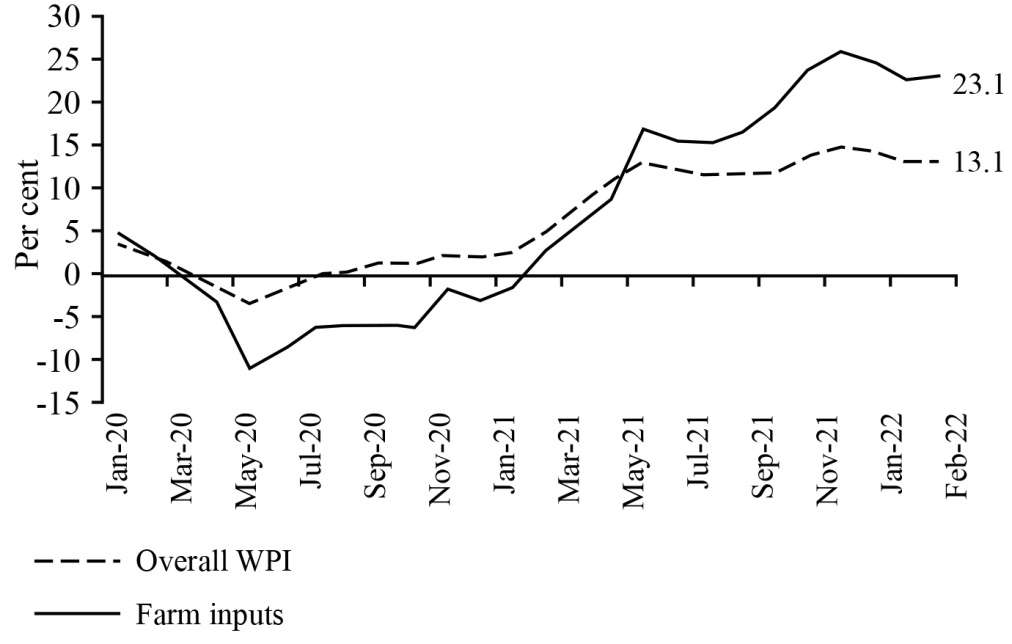
Note: WPI: Wholesale Price Index. Farm inputs: Comprise high speed diesel, fodder, electricity, fertilisers, pesticides, and agricultural and forestry machinery from WPI.
Source: RBI, Monetary Policy Report, April 2022.
This shrinking of returns to the peasantry is not an accidental phenomenon, but a part of Government policy. The Government’s method of inflation control is to squeeze peasants’ and workers’ incomes. Thus, even as the RBI itself estimates farm input cost inflation at 23 per cent, the Government has announced a Minimum Support Price for paddy in the kharif season of 2022 that is just 5.15 per cent higher than the previous year. (Since Government procurement is largely restricted to rice and wheat, the MSPs announced for other crops have limited relevance.)
Income from crop cultivation declines during 2013-19
The situation of those working in agriculture was already precarious before the pandemic and lockdowns, as brought out by the latest official survey of farm households.[3] Farm households’ average monthly household income from all sources of income was only Rs 10,218 per household, or less than Rs 70 per person per day. Only Rs 5,380 per month came from agriculture (Rs 3,798 from farming of crops, and Rs 1,582 from farming of animals). As Roshan Kishore and Abhishekh Jha point out, the income from farming of crops alone comes to a shockingly low Rs 27 per day per member of an average farm household.[4]
This marks a deterioration since the earlier such survey of farm households, carried out in 2012-13. In the intervening six years, the terms of trade for farmers worsened, as can be seen from Chart 4. Partly as a result, between 2012-13 and 2018-19 real income from farming of crops fell by 8.7 per cent for the average farm household.[5] Such is the reality of the promises by the Modi regime about “doubling the income of farmers”.
Thereafter, as we have seen, there was a moderate improvement in terms of trade for two years (2019-20 and 2020-21), followed by a sharp decline in 2021-22.
Larger agricultural workforce, lower income per worker
Thus, while the Government is celebrating the supposed “buoyancy” of agriculture, the condition of those who work that agriculture is sinking. In fact, as we shall see below, there has been an outright fall in income per worker in agriculture in 2019-20 and 2020-21.
The official Periodic Labour Force Survey (PLFS) reveals that agriculture’s share of total employment grew for two successive years. This was a reversal of the long-term trend towards declining agricultural employment share which was witnessed in all earlier periods, and is conventionally associated with the process of economic development.[6]
This strange reversal began in 2019-20, a period which included one quarter of pandemic and lockdown (April-June 2020).[7] It continued in 2020-21. This means the workforce in agriculture would have risen by nearly 35 million in 2019-20, and another 17 million in 2020-21.
Source: Annual Report, Periodic Labour Force Survey (PLFS), 2020-21 for years 2017-18 to 2020-21; Santosh Mehrotra, Jajati Parida, Sharmishtha Sinha and Ankita Gandhi, “Explaining Employment Trends in the Indian Economy: 1993-94 to 2011-12”, Economic and Political Weekly, August 9, 2014.
Did the agricultural workforce grow because agriculture was now booming, and therefore attracted more workers? No. Rather, the lockdowns triggered a crisis of employment and incomes. As families made desperate efforts to eke out a living, large numbers of women were drawn into unpaid work on family farms[8] (in addition to their unpaid domestic work). This accounts for the bulk of increase in the workforce in agriculture in this period. The fact that women joined the workforce in this manner is a sign of distress.
* Rural women in employment as a proportion of all rural women. Source: Periodic Labour Force Survey, Annual Report, 2020-21.
However, with other inputs remaining the same, there are diminishing returns of such additional labour working on the land. While the total income of the agricultural sector (agricultural Gross Value Added) did grow in both years, it grew much more slowly than the workforce in agriculture. Thus the income per worker in agriculture fell very sharply in real terms (i.e., after discounting for inflation). Chart 9 presents the data at constant prices. The fall was more than 10 per cent in 2019-20, and almost 4 per cent in 2020-21.
Source: Census of India for population projections, PLFS 2020-21 for workforce population ratio and agriculture share of employment, National Statistical Organisation for gross value added in agriculture.
Note that this decline continued in 2020-21, the year in which we are told that agriculture was “resilient”, agricultural output “strong” and rural demand “buoyant”.
II. Decline in the Incomes of Rural Labourers
Falling real rural wages
We need to go further to see what different categories of persons working in agriculture actually earned, since there are different classes in agriculture, a few with large land holdings, many with medium or small holdings, and many with no land at all. Whereas among among those who own less land, farm income may not suffice for all their needs, leading some member/s of the household to seek employment elsewhere. Finally, there are those dependent principally on wages, for lack of land.
Rural casual labourers, whether in agriculture or non-agricultural work, are at the bottom of India’s class hierarchy. Their numbers are very large: The Socio-Economic and Caste Census (SECC), 2011, found that manual casual labour was the main source of income for more than half of rural households (i.e., almost 92 million households).[9] Even among the working people of India the incomes of rural casual labour are particularly low: The average daily wages of rural male casual workers are one third those of urban male regular workers; for rural female casual workers, the figure is one-fifth.[10] Their conditions of life are poor: One-third of rural households lived in just one room; more one-third lived in two rooms. Nearly half of rural households lived in kaccha constructions.[11] In three-fourths of rural households, the income of the highest-earning member was less than Rs 5,000 in 2011 (around Rs 9,000 at today’s prices).[12] In brief, these workers are at the level of bare subsistence.
Thus any decline in the wages of rural casual labour, whether in agricultural or non-agricultural work, implies that the very poorest workers are being pushed down, and their very subsistence levels (the costs of reproduction of labour) are threatened.
The following charts (Charts 10-13) bring out the fact that rural wages in both agriculture and non-agricultural sectors have declined overall in real terms (i.e., after discounting for inflation) since 2018-19. During the first year of the pandemic (2020-21), the daily wage rates of most rural workers rose somewhat, presumably because large numbers of migrant workers had returned to their villages, and the resulting dislocation gave the remaining labourers some bargaining power. However, even then real wage rates did not return to the levels of 2018-19. Thereafter, real wages began declining again in 2021-22, and in all cases the real wages in 2021-22 are lower than they were three years earlier.
Sources for Charts 9-12: Wage Rates in Rural India for different months, labourbureaunew.gov.in, deflated by Consumer Price Indexes for agricultural labour and rural labour respectively. Figures given are averages of wage rates for different occupations over each financial year (April-March).
Desperate for employment at any wage
Despite rural wages stagnating or declining, rural working people have been desperate to find work at any wage. For lack of other employment, demand for work under the Mahatma Gandhi National Rural Employment Guarantee Scheme (MGNREGS) has remained much higher than before Covid-19, even after the pandemic has subsided. Chart 14 shows that not only did demand for work soar in 2020-21, when large numbers returned from the cities due to the lockdown, but it remained elevated throughout 2021-22, even after the Delta ‘wave’ subsided. Most remarkably, it has risen sharply in the first three months of 2022-23 (April-June). The number of persons demanding work in June 2022, 43.2 million, was 7.8 million more than the figure for June 2019.
Source: http://mnregaweb4.nic.in , accessed 06/07/2022.
The demand for MGNREGS work rises and falls with the intensity of rural distress; and despite the receding of the pandemic and the resumption of normal activities, distress is not receding, but may be on the rise. As a recent article notes:
That rural families are queuing up for a day job that pays poorly — about Rs 209 a day compared to the average daily wage of Rs 337 for unskilled male workers — is a sign of acute distress in rural India.[13]
III. Rural Demand Depressed
During 2020-21, the year of nationwide lockdowns, the corporate sector celebrated an apparent rise in rural demand, even as urban demand shrank. What could explain this rise? A combination of factors may have been responsible.
(1) Firstly, unlike in other sectors, normal conditions prevailed in agriculture: there was no lockdown, there was a normal monsoon and agricultural production grew at a normal rate. Sales of tractors, two-wheelers and fertiliser rose in 2020-21.
Table 1: Indicators of Rural Demand: Sales in the Second Half of the Last Three Years
| Commodity | Units | 2019-20 H2 | 2020-21 H2 | 2021-22 H2* |
| Tractor sales | lakh | 3.2 | 4.1 | 3.3 |
| Two-wheeler sales | lakh | 68.5 | 76.4 | 57.6 |
| Fertiliser sales | lakh tonnes | 254.6 | 268.9 | 232 |
* Data pertain to October 2021-February 2022.
Source: RBI, Monetary Policy Report, April 2022.
(2) Secondly, the large influx into the villages of workers fleeing from urban lockdowns would have added to total rural demand for fast-moving consumer goods (FMCGs), though at the cost of urban demand.
(3) Finally, large corporate sector firms benefited at the cost of small and informal sector firms. Informal sector units, and even formal sector units of small or medium size, were forced to close for several months after March 2020. An official survey found that two out of every three medium, small and micro enterprises (MSMEs) had been forced to shut operations during the lockdown,[14] whereas large formal sector units remained open.An International Labour Organisation (ILO) study found that many small and micro firms remained shut even after the lockdown was lifted.[15]
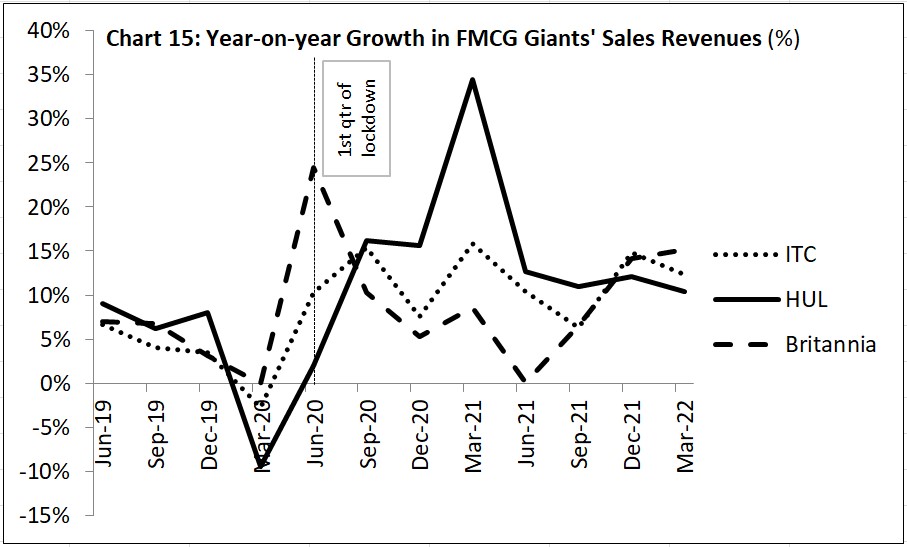
Wherever large formal firms were competing with small firms – largely in the FMCG sector – they gained market share dramatically at the cost of the small ones. Chart 14 shows that giant FMCG firms’ sales growth had been falling during 2019-20, due to the overall economic slump; with the advent of the Covid-19 lockdowns, their sales rose dramatically, as they grabbed the market share of smaller firms, which were now shut. FMCG firms attributed their growth to buoyant rural demand in 2020-21. However, thereafter their sales growth slumped in 2021-22, despite a normal level of agricultural production.
But in 2021-22 the corporate sector experienced a slump in rural demand. This took place despite the fact that the monsoon was again more or less normal, and agricultural production continued to grow at a normal rate. What changed in 2021-22?
(1) As we saw above, farm input costs grew steeply, much more than the prices of farm output, leaving farming households less money to spend on other things.
(2) Rural workers’ real wages for non-agricultural work fell as inflation rose and employment failed to rise.
(3) As urban areas re-opened, migrant workers would have returned to the cities, reducing rural demand somewhat, while increasing urban demand correspondingly.
(4) Many MSMEs, particularly in manufacturing and trade, would have re-opened, some in competition with giant firms. At the same time, many closed for good, rendering workers unemployed. As a result, the large firms would have permanently gained some market share, but overall demand for mass consumption goods would be depressed.
With the worsening of farmers’ terms of trade, tractor sales have declined to near the level of 2019-20. However, sales of two-wheelers and fertiliser have fallen to well below 2019-20 levels. Such differences in demand for different goods may give us a clue to the fates of different classes of farmers.
Even more revealing is the decline in FMCG demand. The demand for these goods gives us a glimpse of the condition of the working people, since these are largely items of ordinary mass consumption. FMCG consumption levels are very low in India, due to widespread poverty; and the rural consumption levels are even lower. As the latest Hindustan Unilever Annual Report notes, India’s per capital FMCG consumption is “among the lowest in the world”. Within this, rural markets, which account for more than 60 per cent of India’s population, account for just 30 per cent of India’s FMCG consumption; that is, the average rural person’s consumption of FMCGs is less than 30 per cent that of an average urban person. So when we talk of a decline in rural FMCG consumption, it means that even these low levels of consumption are being depressed.
NielsenIQ, a market research firm, finds that FMCG growth rates fell for three consecutive quarters, from July 2021 to March 2022. Growth in the sales revenues of the FMCG corporate sector is coming on account of price hikes by large firms; the volumes of FMCG sales are declining – in other words, the absolute quantity people are consuming is declining. Consumers reduced their purchases of non-food FMCGs more sharply, with volumes falling by 9.6 per cent, but the volumes of even food categories fell by 1.8 per cent. This is so in both urban and rural areas, but it is more so in rural areas, with volumes of FMCG sales falling by 5.3 per cent in the January-March 2022 quarter over the corresponding quarter of 2021.[16]
One reason large firms are able to increase their revenues by hiking prices is that they face less competition due to the closure of small firms. A NielsenIQ report said that in the July-September 2021 quarter, 14 per cent of small FMCG manufacturers had exited the business compared to the year-ago period.[17] The same firm reports “an increase in the exit of small [FMCG] manufacturers” in the January-March 2022 quarter.[18]
Giant firms have responded to declining sales volumes with what the industry terms ‘shrinkflation’ – rather than increase the price of the package, firms reduce the quantity in each package. Data analytics firm Kantar found that the average pack size of FMCG products in India shrank by nearly 15 per cent during February-April 2022 compared to the year-ago period. This was particularly so for small packs, which tend to be bought by the poor. Overall, Kantar found that, by weight, packed consumer goods were 10 per cent costlier than in the year-ago period. A March 2022 report by BNP Paribas estimated price hikes in large FMCG categories such as soaps, detergents, shampoo, biscuits and edible oils at 15-20 per cent.[19]
These are hardly luxuries, but they are being given up by working people, particularly those in the rural areas. Given that rural consumption of FMCGs is already so low, the outright decline in volumes of FMCG consumption implies that rural workers and peasants are being impoverished, and even their subsistence levels of consumption are being lowered further. All this is taking place at a time when agricultural production is more or less normal. That is, it is the overall economic policies that are depressing the incomes and consumption of the rural masses.
- The index of terms of trade for farmers is defined as: (Index of Price Received for Farm Products ÷ Index of Price paid for Farm Inputs, Final Consumption and Capital Investment) × 100. Thus if the prices received grow exactly at the same rate as prices paid out, the index will remain at 100; if the prices received rise more slowly than the prices paid out, the index will fall, etc. ↑
- Sanjeeb Mukherjee and Indivjal Dhasmana, “Terms of trade go against farmers in FY22 after a gap of two years”, Business Standard, January 20, 2022. ↑
- Situation Assessment Survey of Agricultural Households, 2018-19, National Sample Survey Organisation (NSSO). ↑
- Roshan Kishore, Abhishekh Jha, “Farmers earned Rs 27 a day from cultivation in 2018-19”, Hindustan Times, September 14, 2021. ↑
- According to the Situation of Agricultural Households in India 2012-13, National Sample Survey 70th Round, the net receipt from cultivation of the average agricultural household was Rs 3,081 per month. The corresponding figure from the Situation Assessment of Agricultural Households and Land and Holdings of Households in Rural India 2019, National Sample Survey 77th Round is Rs 3,798. While the nominal figure thus rose by 23 per cent, the Consumer Price Index for Agricultural Workers rose 35 per cent in the same period, implying a decline in real terms. ↑
- Contrary to the conventional view, we do not hold the view that the decline that was earlier taking place in agriculture’s share of employment in India was an outcome of healthy economic development; rather, it was the outcome of a distorted pattern of development. The slow decline in agriculture’s employment share was largely the result of the push factor, i.e., the crisis in agriculture, rather than the pull of growth in jobs paying a living wage. As a result a large proportion of the working households carry on multiple employments (as peasants, wage workers, and petty producers/retailers) to stitch together a living. ↑
- April-June 2020; the PLFS covers the period July-June, unlike the Indian financial year, which is April-March. ↑
- See Radhicka Kapoor, “The grim reality hidden by the recent decline in unemployment rates”, Indian Express, August 9, 2021. ↑
- The main source of income for 51.1 per cent of rural households was manual casual labour. ↑
- International Labour Organization, India Wage Report: Wage policies for decent work and inclusive growth, 2018, p. 23. The figures are 32 per cent for male workers and 22 per cent for female workers. The calculations are based on the National Sample Survey for 2011-12. ↑
- SECC, 2011. The exact figures are: 32.7 per cent of households lived in one room, and 37.5 lived in two rooms. 44.5 per cent of households lived in kaccha dwellings, with walls made of grass/thatch/bamboo, plastic/polythene, mud/unburnt brick, or stone not packed with mortar. ↑
- The SECC found that in 74.4 per cent of rural households the income of the highest earning member was less than Rs 5,000. ↑
- Sayantan Bera and Nikhil Rampal, “MGNREGS hits record with 3.1 crore families seeking work in May. It’s a cry for help from Bharat”, The Print, June 18, 2022. ↑
- “MSME Study Confirms Lockdown Battered Small Business in India”, The Wire, February 7, 2022. , ↑
- Situation analysis on the COVID-19 pandemic’s impact on enterprises and workers in the formal and informal economy in India, International Labour Organization, 2021. ↑
- “FMCG demand slows in rural markets for third successive quarter in Q1 2022: NielsenIQ”, Moneycontrol, June 1, 2022. ↑
- NielsenIQ, “Metros and pricing buoy India’s FMCG industry in Q3 2021”, January 5, 2022. ↑
- “FMCG demand slows in rural markets for third successive quarter in Q1 2022: NielsenIQ”. ↑
- Nandita Venkatesan, Suneera Tandon, “What is ‘shrinkflation’ and how is it playing out in India?”, Hindustan Times, June 28, 2022. ↑