— July 30, 2022
On July 18, 2022, the State Bank of India Research Department issued a “Special Report on Agriculture”. The principal claim of the report is that “Farmers’ income doubled in FY22 [2021-22] as compared to FY18 [2017-18] for certain crops in some states… while in all other cases it rose in the range of 1.3-1.7 times.” (emphasis added)
This factoid is destined to be propagated widely. To say the SBI report was widely covered would be an understatement: it appeared in the Times of India, Economic Times, Hindu Business Line, Business Standard, Financial Express, The Tribune, Dainik Jagran, Dainik Bhaskar, Op India, The Print, Swarajya, Zee News, News 18, and many other media outlets. All of these outlets repeated the contents of the report without venturing any comment of their own on these findings.
The political agenda of the SBI report is not subtle. The first sentence is “Agricultural Policies are ushering in a greater tomorrow…”, and it goes on to celebrate the farmer-related initiatives of the present government in purple prose. It explicitly links its ‘findings’ to the Modi government’s announced goal of doubling farmers’ income by 2022-23.
Not coincidentally, the report was released on July 18, the very day the Government set up a committee to consider the demand of farmer organisations for a legal guarantee of Minimum Support Price for all crops. The SBI report claims that:
Minimum Support Price (MSP), increasingly aligned with market linked pricing, has been pivotal in ensuring passage of better prices to farmers and has in many cases led to optimal price discovery…
Given this background, it would be important to study the SBI Research report itself.
However, it turns out that there is no ‘report’ as such. There is only a brief summary of ‘findings’, so short on relevant detail and so abundant in irrelevant material that one wonders at the journalists who spun articles out of it.
Let us look at some of the features of this unique research report.
Methodology shrouded in mystery
The authors state: “we have taken a well-spread well-represented probabilistic sample of farmers to estimate the change in income from FY18 to FY22…. [It] not only covers the large farmers but gives proper representation to small and marginal farmers”. However, they provide no further details. The data set of their study has not been made available to other researchers. The authors could have provided at least a modicum of information about it in order to give it some credibility; but even this modicum is not to be found.
SBI does not have a history of conducting annual surveys of farmers. Nor would it be a simple exercise to do so: The National Sample Survey (NSS) has conducted just three surveys of agricultural households in 20 years, each one a major exercise employing an army of trained staff. For each survey, the NSS publishes detailed information regarding the definitions, sample, methodology, and results, including unit-level data.
So when the SBI Research team one fine morning announced the “results” of a study of farmers’ income for five years, it ought to have aroused great curiosity. How were the data gathered? How large was the sample? How many each of marginal, small, medium and large farmers were covered? How does the sample compare with that of the NSS on agricultural households, which the report cites? There is not a clue.[1]
The study indicates that the information was gathered without a survey as such: “Our study [is] based on primary data of SBI agri portfolio across states containing granular data of various crops from agri-intensive branches…” It thanks the SBI Agri Business Unit “who patiently and assiduously navigated the myriad and voluminous data points received through thousands of branches and channels/systems.” But State Bank branches cannot have complete information regarding the costs of even its own borrowers; to gather such data would require a proper survey, which evidently was not done.
Since the sample appears to be composed solely of SBI borrowers, how representative are such borrowers of all farmers? For example, we know from official surveys that, the poorer the farmer, the greater his/her dependence on ‘non-institutional’ sources of loans – most prominently moneylenders of different types. This section would be less represented in the SBI data. Yet the study confidently claims to have covered “all” types of farmers.
The study has selected the following states, and crops within those states: Rajasthan (wheat), Gujarat (cotton, groundnut), Maharashtra (soyabean, sugarcane), and Karnataka (cotton, paddy). But it provides no explanation of why it selected these four states and these six crops. Nor of how these are meant to substantiate its claim of covering all farmers.
On the basis of what formula has the SBI report calculated “farmers’ income”? Again, no clue. The Commission for Agricultural Costs and Prices (CACP) calculates returns to farmers using several alternative formulas of the expenses of cultivation: A2 (actual paid out costs); A2+FL (actual paid out costs plus imputed value of family labour); and C2 (comprehensive cost including imputed rent on owned land and interest on capital). The National Sample Survey similarly calculates the expenses of cultivation with as well as without imputed costs. However, SBI Research gives no indication of how it has calculated costs, and therefore the returns. As mentioned earlier, it is not clear how SBI Research would obtain data regarding some of these costs without a survey. In the absence of any details, what meaning do their figures have?
Ignoring inflation
Strangely, when the report refers to “growth in farmers’ income”, it does so in current rupees, i.e., unadjusted for inflation. Surely SBI Research is aware that any meaningful measure can only be in real, i.e., inflation-adjusted, terms? After adjusting for inflation (at the Consumer Price Index-Rural), the claimed increase of 30 per cent in current rupees between FY18 and FY22 (for Rajasthan wheat farmers) becomes an increase of only 8.4 per cent in constant rupees.
The report also says, on the basis of the earlier mentioned NSS surveys of agricultural households, that their average monthly income rose 59 per cent between 2012-13 and 2018-19. However, this too is in current rupees. After adjusting for inflation, the increase comes to only 17.7 per cent in constant rupees.
Moreover, agricultural household income in the NSS survey includes income from wages, non-farm business, and farming of animals. Whereas, if we look at only income from crop cultivation, which is what is under discussion here, there is an 8.8 per cent fall in real terms.[2] Even if we combine income from crop cultivation and farming of animals, there is a fall in real terms.
Irrelevant statistical tests
The SBI report, while not divulging any of the essentials, provides many colourful charts in an effort to show that inequality has not risen. However, if the sample is a mystery in the first place, tests of growth in inequality within the sample are meaningless.
The report also carries out statistical tests to determine whether the increase in income between FY18 and FY22 is statistically significant. But you hardly need tests to show that an increase of 30, 70, or 100 per cent is statistically significant! The problem is with their method of arriving at those figures. This exercise merely diverts from the questions about the collection of data, the representative nature of the sample, the methodology of calculating income, and the failure to present income in real terms. It appears that, by filling pages with impressive-looking statistical tests, the authors of the SBI report are enjoying a private joke at the expense of journalists.
MSPs: Unsubstantiated claims
The SBI report provides a table of Government-declared Minimum Support Prices (MSPs) for different crops in FY15, FY22, and FY23, and declares that “MSP price increases has [sic] helped in better price discovery…”[3]
However, merely reproducing a table of MSPs has no meaning. There is no procurement for most crops, and hence most MSPs are academic. Sales by farmers actually take place at much below MSPs, as brought out in CACP reports.
SBI Research’s stab at linking the rise in farmers’ income (claimed in its report) to the Modi government’s increases in MSPs is unconvincing. To prove such a case, one would have expected the SBI ‘study’ to cover crops and states on which MSPs have a significant impact. But the study has not attempted this. Of the specific crops and states included in the study,
(1) There is no procurement in sugarcane or soybeans;
(2) Karnataka did not procure any paddy;
(3) Rajasthan’s share in procurement of wheat was only 5.4 per cent in 2020-21;
(4) The shares of Karnataka and Gujarat in the procurement of cotton were 3 per cent and 10 per cent respectively in 2019-20 (in other words, the gains from “better” MSPs for the farmers in these states would not have been significant.)
(5)Though there was procurement of groundnut in Gujarat, the share of the state in total procurement is not known.[4]
Indeed the SBI report makes no effort to back up its bald assertion that the Modi government’s MSPs have helped better “price discovery” or had a positive effect on farmers’ incomes.
The real situation of India’s agriculture
What is the reality?
Terms of trade deteriorating
1) The income of farmers who market at least part of their crop depends to a large extent on the terms of trade (ToT) – i.e., the price of their output vs the price of their expenditures. The period between 2011-12 and 2018-19 witnessed a deterioration in ToT for farmers (see Chart 1). They improved in 2019-20, and then dipped slightly again in 2020-21. However, there has clearly been a sharp deterioration in 2021-22, for which the official data are still awaited (see Chart 2).
Source: Agricultural Statistics at a Glance 2020, Ministry of Agriculture and Farmers’ Welfare.
Chart 2: Farm Input Cost Inflation vs Overall Wholesale Price Inflation, January 2020-February 2022
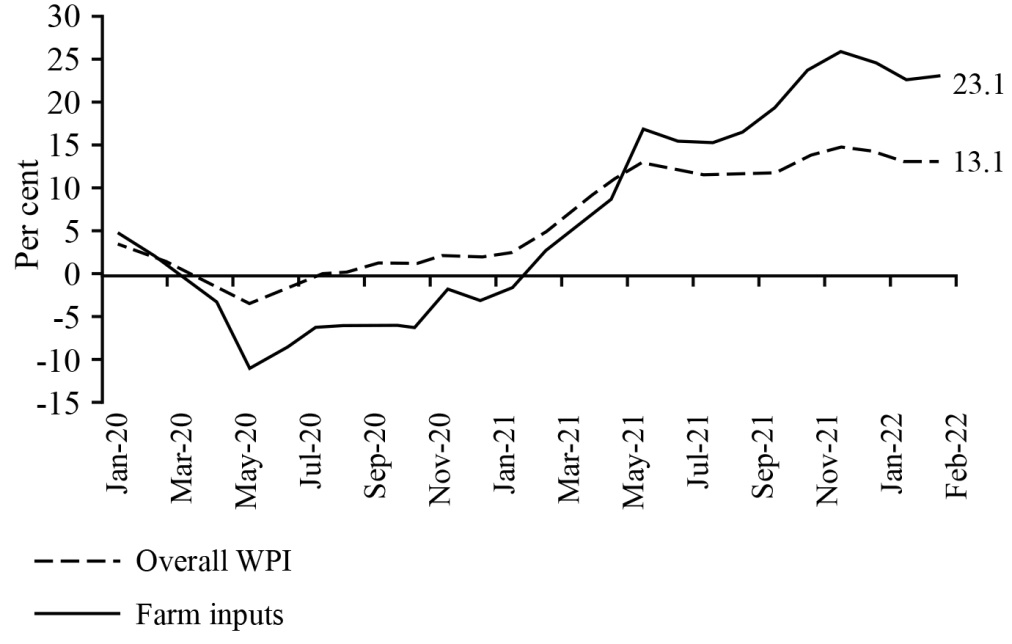
Note: WPI: Wholesale Price Index. Farm inputs: Comprise high speed diesel, fodder, electricity, fertilisers, pesticides, and agricultural and forestry machinery from WPI. Source: RBI, Monetary Policy Report, April 2022.
One should note that, even for the few crops in which there is substantial Government procurement, recent MSPs may not guarantee remunerative returns. Note that in the current year (FY23), the MSP of rice has been set at only 5 per cent over FY22, whereas inflation in the RBI index of farm input costs was running at over 23 per cent in February 2022 (Chart 2).
Agriculture’s share of GDP rising – not a fact to celebrate
2) The SBI report further states that “Growth in the Agriculture sector was positive in FY21 even as all other sectors recorded negative growth. This trend has continued in FY22… too. This has, in turn, led to a higher share of agriculture in the country’s GDP since March 2019.” It claims that “The agrarian economy… [emerged] as the anchor for broader economy during the tumultuous days of pandemic.”
This depiction makes a virtue of a calamity: Agriculture’s share rose merely because all else collapsed. In 2019-20, the year before the pandemic, there was a grave industrial recession, due to lack of demand (in fact, the deterioration of the terms of trade of farmers over the previous 8 years also contributed to the depression of demand for industry). Manufacturing GDP fell 3 per cent, and construction grew just 1 per cent. Overall GDP grew at its lowest rate in more than a decade. It was in these depressed circumstances that agriculture grew faster than overall GDP, and hence agriculture’s share in GDP rose.
In the pandemic period (2020-21 and 2021-22) GDP in agriculture and allied activities grew at a normal but unspectacular rate – slightly below the average rate of the preceding 8 years (see Chart 3). GDP specifically in crop agriculture (which is the focus of the SBI ‘study’) grew at just 1.9 per cent in 2020-21 (see Chart 3).[5] This is hardly an achievement to tom-tom. But again, because almost all other sectors of the economy were locked down for many months, and had negative growth, agriculture accounted for a larger share of GDP in 2020-21 too.
Source: National Statistical Office.
Growth in agricultural workforce, a sign of distress
(3) While agriculture GDP grew moderately in the last two years, in the same period there has been a dramatic addition to the agricultural workforce.[6] This addition consisted mainly of women, working as unpaid helpers on family farms. With the loss of family income due to the lockdown, women have been pressed into agricultural work (in addition to their household work) in order to somehow bring in a few more rupees.
* Rural women in employment as a proportion of all rural women.
Source: Periodic Labour Force Survey, Annual Report, 2020-21.
However, what this means is that the income per worker in agriculture has fallen (see Chart 5). It is a sign of distress.
Note: We have taken GDP data for crop agriculture and livestock for the April-March financial year, whereas the PLFS data relate to July-June.
Source: Census of India for population projections, PLFS 2020-21 for workforce population ratio and agriculture share of employment, National Statistical Organisation for gross value added in agriculture.
Slump in rural demand
4) There is a slump in rural demand reported by companies producing fast-moving consumer goods (FMCGs) and two-wheelers, despite the second successive year of a more or less normal harvest (barring the wheat crop in 2022). Indeed, the absolute volume of rural sales of these goods has fallen in 2021-22. This does not support the SBI report’s claims of buoyancy in agricultural incomes.
In brief, all the evidence in the real world points to the bleak state of farmers’ incomes in India, and the further downturn now taking place. In the face of this reality, the SBI Research authors perform a magic trick: they conjure up a private, inaccessible data set to prove that farmers’ incomes are booming. But, like all magic tricks, this one too relies on diversion and illusion. Indeed, it seems the conclusions of the ‘study’ have been arrived at first – namely, that farmers’ incomes have “doubled”, as promised by the rulers several times – and the researchers have somehow generated the required data.
In recent years, SBI Research has gained a reputation for making very tall claims. In January 2018, the head of SBI Research (along with a co-author) published a study claiming that 7 million people would be added to the payroll of the organised sector in 2017-18. [7] While labour economists pointed out gaping holes in the study,[8] it was promptly cited by the Prime Minister, the Finance Minister, and so on.
More recently, SBI Research produced a study claiming that India’s informal sector had shrunk from over 50 per cent in 2017-18 to just 15-20 per cent in 2020-21 – a level comparable to that of Europe. This note too was taken apart by a number of economists for making absurd assumptions and leaps,[9] but that did not prevent its wide propagation in the media.
Factoids generated by these earlier reports/studies continue to be in circulation; the same may happen with SBI Research’s doubling of farmer income. It is all the more necessary that it be debunked.
[Thanks to Biswajit Dhar for very helpful comments on a draft; errors, if any, are our own.]
https://rupeindia.wordpress.com/2022/07/30/sbi-research-doubles-farmers-income/
- The report even claims to estimate the non-farm income of farmers. Again, there is no indication of how these data have been obtained. ↑
- Income from crop cultivation was Rs 3081 in 2012-13; it rose to Rs 3798 in 2018-19, a 23.3 per cent rise in current rupees. However, the average CPI-Rural for 2018-19 (July-June) was 35.1 per cent higher than for 2012-13 (July-June). ↑
- For some reason, the study here drops the comparison with FY18, and instead goes back to FY15. Presumably the effort is to show the increases made in the Modi era. ↑
- All figures/information cited are from Agricultural Statistics at a Glance 2021. ↑
- Separate data for crop agriculture are not yet available for 2021-22. ↑
- On the basis of the Periodic Labour Force Survey (PLFS), we find a rise of 17.4 per cent and 7.4 per cent in the agricultural workforce during 2019-20 and 2020-21, respectively. (Unlike annual GDP data, which relate to the financial year April-March, the PLFS covers the year July-June. Hence the PLFS 2019-20 covers July 2019-June 2020, which includes one quarter of lockdown. PLFS 2020-21 covers July 2020-June 2021.) ↑
- “The study that claimed 7 million people would be added to the payroll in 2017-18 was triggered by the Prime Minister’s Office (PMO), which had asked the NITI Aayog last October to give “quick indicators for direct or indirect reflections on employment data” to be able to arrive at “desired trends in employment at the earliest.” The NITI Aayog, in turn, helped the authors of the study — Towards a Payroll Reporting in India to gain access to data of around 80 million Employees’ Provident Fund (EPF) subscribers. Since this database is not in the public domain, the Aayog acquired the data from the Employees’ Provident Fund Organisation’s (EPFO’s) national data centre office in Hyderabad and passed it on to the authors — Indian Institute of Management (IIM) Bangalore Professor Pulak Ghosh and State Bank of India (SBI) Chief Economist Soumya Kanti Ghosh — who arrived at their estimates on payroll addition based on that. The government’s think tank also allowed the authors to work from its offices. This was perhaps the first time that the EPFO data on employees was made available to a select group of nongovernment researchers. Sources familiar with the developments say that even the EPFO was not fully aware that its employment data would be used by somebody outside the government system. The study has been widely quoted by the Union government to battle criticism of jobless growth in the economy. Four days after the study by Ghosh and Ghosh was made public, Prime Minister Narendra Modi said in a televised interview that the data on 7 million jobs was a result of a study.” – Somesh Jha, “7 million jobs in FY18? An ‘independent’ report with Government’s hand-holding”, Business Standard, February 16, 2018, https://www.business-standard.com/article/economy-policy/7-mn-jobs-created-in-2017-18-niti-helped-ghosh-ghosh-access-epfo-data-118021501546_1.html ↑
- E.g., Mahesh Vyas, “Primitive explanations of primitive assumptions”, Business Standard, January 29, 2018 https://www.business-standard.com/article/opinion/primitive-explanations-of-primitive-assumptions-118012900745_1.html ↑
- See Biswajit Dhar, “Has India’s Informal Economy Really Shrunk? The Actual Story Is Different”, The Quint, November 6, 2021, https://www.thequint.com/voices/opinion/indias-informal-economy-may-be-shrinking-but-the-real-story-is-different ; R. Nagaraj, Radhicka Kapoor, “What is ‘formalisation’ of the economy?”, The India Forum, January 12, 2022, https://www.theindiaforum.in/article/what-formalisation-economy, and P. Bhattacharya, “Don’t believe everything they tell you about breakneck formalization”, Mint, November 9, 2021,https://www.livemint.com/opinion/columns/big-claims-of-rapid-economic-formalization-are-suspect-11636390573314.html ↑