Nos. 70 & 71, April 2018
|
|
|
Nos. 70 & 71, April 2018 |
|
|
Nos. 70 & 71 (April 2018)
About the articles in this special issue Understanding Rural Distress and Uncivil Social Networks of Economy in Eastern India: The Case of the Odisha-Telangana Brick Kiln Labour Circular Migration Stream -- Dr. Tathagata Sengupta & Dr. G.Vijay Odisha Government’s Cynical View: Migration Is a Solution -- Kshetrabasi Naik
|
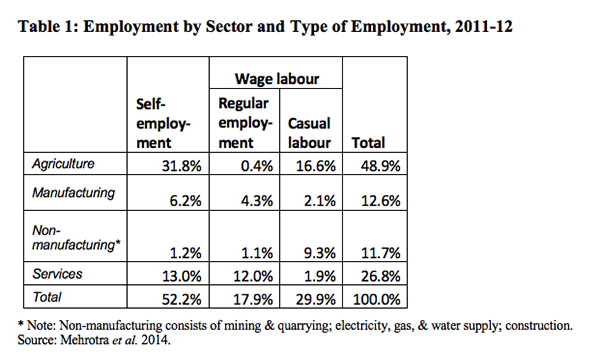
India's Working Class and its Prospects III. The occupational structure of India Having taken this detour to make a thumbnail sketch of Capital, as well as some of the criticisms made of it, let us try to apply some of these insights to the Indian reality. How far did Marx’s picture of the workforce match reality? During the course of capitalist development in Britain up to the time of Capital, there was a substantial shift of workforce from agriculture to industry, so that by 1871 well over half of adult male employment was in the secondary sector (manufacturing, construction, etc), less than one-fifth was in the primary sector (essentially agriculture, fishing and mining), and the remainder, about one-fourth, was in the services sector (including transport, retailing, personal and professional services).(Shaw-Taylor and Wrigle, 2006) Proletarians could be found among propertyless wage labourers in all three sectors (for example, agricultural labourers and miners in the primary sector, and railway workers and shipping labour among the services). Above all, the industrial proletariat loomed largest. Thus Marx was quite right in viewing the proletariat as the “immense majority” of society in Britain. In 1867, Marx believed that the less developed countries would sooner or later follow the path of the countries more developed industrially; also that their labourers’ misery would match that of the industrial and agricultural labourers of Britain. (Marx 1990, 90) However, in fact, apart from a handful of countries that constitute today’s developed world, other countries did not follow that path, as they were made colonies or semi-colonies. India accounted for a quarter of world manufacturing output in 1750; by 1880 it accounted for 3 per cent. (Simmons 1985) Indeed, in the first century of British rule India turned from a major exporter of textiles to a net importer of them. Marx quotes the Governor General’s report of 1834-35, which states that “The misery hardly finds a parallel in the history of commerce. The bones of the cotton-weavers are bleaching the plains of India.”(Marx 1990, 558) Further, Marx points out that “By ruining handicraft production of finished articles in other countries, machinery forcibly converts them into fields for the production of its raw material. Thus India was compelled to produce cotton, wool, hemp, jute, and indigo for Great Britain.” (Marx 1990, 579) Partial change There has been a partial change since then. The share of agriculture in the workforce has fallen, particularly since 2004-05. Agriculture is now about half the workforce.11 As a result, some economists are enthused that the social transformation of India is underway. However, as we shall see, there is little to enthuse about. Other analysts view these changes as a process of ‘proletarianisation’ and class polarisation along the lines of capital vs labour. However, the picture is more complex. Let us recall the definition and features of Marx’s proletariat: the class of wage labourers who, having no means of production of their own, are reduced to selling their labour power in order to live; growing as the dialectical counterpart of capital; the immense majority of society; concentrated in greater masses, feeling their strength more; disciplined, united, organized by the very mechanism of the process of capitalist production itself; completely degraded, compelling them to revolt; with nothing of their own to secure or fortify. What do we find in India? Struggle to muster a subsistence from multiple sources Wage labour in India can be divided into regular wage employment and casual wage employment. Only two out of five wage labourers get regular employment (see Table 1). The daily average wage rates for casual labour averaged just over one-third the wages for regular workers.12 Given these low and irregular earnings, casual labour households may be supplementing their wage earnings with some form of self-employment. For example, while the man may be employed as a wage labourer, the woman may be engaged in agriculture and tending livestock.
According to National Sample Survey (NSS) data for 2012-13, average ‘farmer household’ income from all sources was Rs 6,426 per month, of which 32 per cent came from wages, 60 per cent from farm business, and 8 per cent from non-farm business. The poorest farm households, with less land, had a higher share of wages in their total income. For 87 per cent of farmer households, farm income alone was less than the consumption expenditure of the household. Hence wage income was a necessary supplement to farm income. Notwithstanding this, for almost 70 per cent of all farmer households, total income from all sources, farm and non-farm, was less than consumption expenditure. That is, despite wage income, they ran a deficit. Households carry on multiple occupations in an attempt to keep their heads above water, often toiling both as worker and as peasant or petty proprietor. Even for the category of farmer households with less than 0.01 hectares of land, farming of animals and non-farm business made up 36 per cent of income. (RUPE 2017a, pp. 26-29) Above, we assumed wages from industry are helping to sustain agricultural households. But the contrary may be true: the agrarian sector may be subsidising large industrial capital, by taking care of part of the costs of reproduction of the family of the worker. This includes part of the food supplies, care of the elderly, maternity care, care of small children, and rest and recuperation for workers themselves. If wages are below the costs of reproduction, it could indicate that the agrarian sector is bearing part of the costs of reproduction of the worker family. Notes: 10. In 1972-73, the share of agriculture and allied activities was 73.9 per cent, the secondary sector (including mining, manufacturing, electricity and construction) at 11.3 per cent, and services at 14.8 per cent. (IHD 2014, p. 208 Unless specified otherwise, data on employment in the following pages are taken from this report.) (back) 11. The share of agriculture in total employment is 48.9 per cent according to the National Sample Survey 2011-12; however, according to the Census of 2011, the share of agriculture is 54.6 per cent. (back) 12. Rs 143 per day for casual labour in 2011-12, compared to Rs 392 for regular workers. (back)
|
|
| Home| About Us | Current Issue | Back Issues | Contact Us | |
|
|
All material © copyright 2018 by Research Unit for Political Economy |
|