No.s 66-67, May 2017
|
|
|
No.s 66-67, May 2017 |
|
|
No.s 66-67 (May 2017) I. Modi Govt’s ‘Pro-Farmer’ Claims II. Post-2004 Spell of Growth Over IV. Fairy Tales about Foreign Investment V. Insuring the Govt against the Peasantry VI. Ruinous Drive to Throw Agriculture to ‘the Market’ VIII. Tightening Grip of Parasitic Forces
|
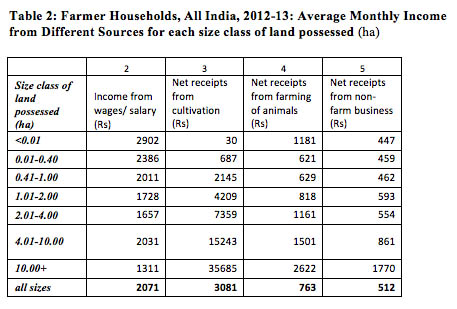
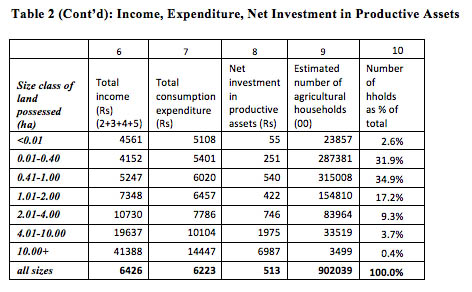
III. Peasantry in Fetters Peasant households in deficit It is striking that even in the earlier period (2004-12), when terms of trade for agriculture were improving and growth rates were higher, this improvement appears to have had only a limited impact on the vast mass of peasantry. Data from the 70th Round of the National Sample Survey (2012-13) show that average farmer household income from all sources was Rs 6,426 per month, of which Rs 2,071 came from wages, and Rs 512 from non-farm business; the rest came from cultivation and farming of animals. For almost 70 per cent of farmer households, total income from all sources (cultivation, farming of animals, non-farm business and wages) was less than consumption expenditure. That is, these households were running a deficit. Indeed, farm income alone (from cultivation and farming of animals) was less than consumption expenditure in the case of 87 per cent of farmer households. (Taking cultivation income alone the Economic Survey 2015-16 calculates that average annual income of the median farmer from cultivation, net of production costs, is less than Rs 20,000 in 17 states.) Evidently, what in Marxist terms is called ‘simple reproduction’, mere re-creation of the initial conditions of production, is itself under threat for the majority of the peasants. (It should be kept in mind that the consumption costs of the peasantry, the costs of their subsistence, must also be considered part of the costs of reproduction, as wages would be in the case of a factory.) On the other hand, households with 4-10 hectares had an income of Rs 19,637 per month, and households with more than 10 hectares had an income of Rs 41,388 per month. These households had sizeable savings after incurring consumption expenditure.
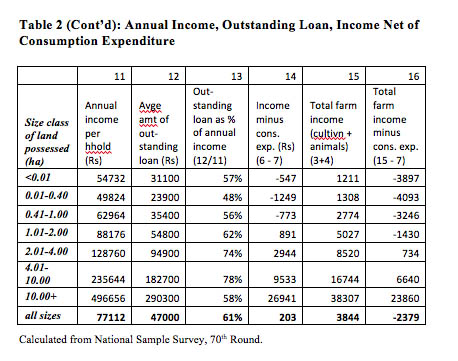
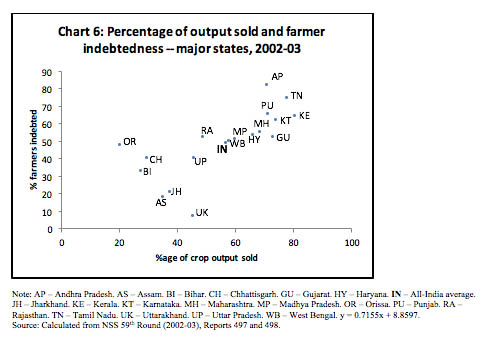
Growing indebtedness According to the NSS data, the percentage of indebted farmer households rose from 48.6 per cent in 2002-03 to 51.9 per cent in 2012-13; 12 of 18 states saw an increase in prevalence of indebtedness of farmers. The debts of farmer households, as a percentage of their annual income, rose from 49.6 per cent in 2002-03 to 61 per cent in 2012-13, an increase of 11.4 percentage points.1 It is true that the fact of increasing indebtedness does not in itself tell us anything: it could be argued that it is a sign of households’ increasing access to credit. That may indeed be the case with the wealthier agriculturists, who have sizeable incomes, as we noted above. However, such is not the case for the bottom 70 per cent of peasant households, who are unable to meet consumption needs from their income, and a large portion of whose indebtedness is to usurious moneylenders. In their case, rising indebtedness does not signal increasing prosperity. Rather, it signals a vicious circle of debt. Moreover, there has been a collapse in the share of bank agricultural credit going to long term purposes – from 70 per cent in 1991-92 to 40 per cent in 2011-12. That is, investment has been suffering.2 This too indicates that growing indebtedness is an unhealthy sign.The above data relate to the period of relatively better growth; they would have deteriorated in the three years since, which have witnessed slower or even negative agricultural growth. Importantly, they indicate that even a period of more rapid growth in India did not overcome certain underlying agrarian constraints, while it might have alleviated their effects for a while. Return of the moneylender From the early days after bank nationalisation (1971) to the start of the liberalisation era (1991), the percentage of indebted cultivator households fell. Moreover, the share of total borrowings from ‘non-institutional’ sources – in the main, moneylenders, landlords and traders – too fell, indicating better borrowing terms for the cultivators. True, respondents to successive surveys probably understated the size of their debt to moneylenders/traders, for various reasons. Nevertheless, there does seem to have been an improvement in the situation. However, after 1991, with banks given official encouragement to pursue urban/metropolitan business and give short shrift to agriculture and small businesses, the percentage of indebted farmer households began climbing once more, as did their indebtedness to moneylenders and other ‘non-institutional’ sources. Thus the 2002-03 data, when released, sparked a public discussion about the “return of the moneylender”. Since then the situation has only worsened, despite a seemingly large increase in agricultural credit in the post-2004 period (most of this increase in credit, however, is not really agricultural; see footnote 3 of Part II of this article). Larger farmers have greater access to bank credit, at lower interest rates. So it is not surprising that the 2012-13 data show that, the smaller the landholding, the greater the dependence on the moneylender. The NSS did not collect data on the size of interest payments or interest rates prevailing. (Indeed, it appears the authorities are uninterested in collecting data on and studying informal credit markets, which continue to play such a large role in India.) However, it is well known that interest rates on loans from moneylenders are at least 2 per cent a month, and are generally higher. Such rates of interest are sustainable for high-return speculative activity, but are ruinous for productive activity, especially for agriculture, with its low and uncertain returns. Moreover, several studies over the years have pointed out that the moneylender may play more than one role: he may also be the supplier of inputs, purchaser of output, landlord, or employer. This interlocking of markets for credit, inputs, produce, land, and labour allows the dominant party to extract more than would be deemed permissible if his link with the peasant had been in only one market. On the basis of the NSS estimate of 90.2 million farmer households, the total debt of these households would be Rs 423,000 crore, out of which Rs 123,000 crore (29.5 per cent) would be owed to moneylenders, traders, employers, landlords and shopkeepers (whom we can count among the dominant rural classes). Obstacle to investment This is particularly so for the small holdings, which account for the vast majority of holdings but only a small share of the land. The share of non-institutional agencies in the debt of small and marginal holdings is much higher than in the case of large holdings; the interest burden would accordingly be higher for the small holdings. (The All-India Debt and Investment Survey reports that, for more than 80 per cent of the institutional debt, interest rates were in the range of 6-15 per cent; whereas for non-institutional debt, interest rates were 20-30 per cent for 35 per cent of the debt and over 30 per cent for another 34 per cent of the debt.) Small and marginal peasant households are unable to meet their consumption expenditure from their income (those with less than 0.4 hectares are in deficit of Rs 1,249 per month; those with 0.4-1 hectares are in deficit of Rs 773 per month). Obviously, they are unable to fund investment from their surpluses. Paucity of land under the vast majority of holdings, meagre returns on farming, and large interest payments on debt appear to be major obstacles to agricultural investment; and low investment in turn keeps productivity low.3 Dominant position of traders The Economic Survey 2015-16 gives a picture of the large margins between farmgate prices (i.e., those received by the peasant) and wholesale prices. Significantly, it notes that trading margins are lower for crops such as paddy and wheat, in which the declaration of a Minimum Support Price is followed by actual Government procurement. This indicates that, in the absence of Government procurement, peasants are compelled to accept depressed prices from private traders; when Government procurement exists, that fact itself raises the prices paid by private trade. Among crops lacking significant Government procurement, trading margins are larger in crops which are perishable (potatoes, onions, groundnuts), compared to tur and moong. This indicates that traders are able to take advantage of the lower holding power of growers of perishable crops to force distress sales. This weak bargaining power is particularly significant in the light of the considerable shift of area to fruits and vegetables during the last decade.4 Much of this is grown by small farmers, for whom this labour-intensive activity is a method of overcoming their land constraints and employing their abundant labour power.5While production of these crops has grown rapidly, producer prices have fluctuated wildly, frequently crashing below the cost of production. There have been numerous instances of peasants dumping their produce on the road, or leaving it unclaimed in cold storages. At the same time, consumers have faced repeated price surges and shortages in staple vegetables such as onions, potatoes and tomatoes. This situation clearly calls for State intervention (i) to ensure stable, predictable and assured remunerative prices to growers; (ii) minimising of wastage through public investment in a widely dispersed network of collection, cold storage and transport; and (iii) supply to small retailers at reasonable prices. However, as we have seen, the Budget opens up the procurement, storage, processing, transport, and retail marketing of farm products to foreign direct investment, all in the name of benefiting the farmer. Whether or not FDI materialises, the State’s abdication of any responsibility for ensuring returns to the peasant will strengthen the hand will further strengthen the hands of private procurement agencies against the peasant. Small peasants are also exploited by traders in inputs, who often provide credit as well. The Economic Survey 2015-16 points out that about 51 per cent of Indian farmers buy urea at above the stipulated maximum retail price (MRP). On average, black market prices are 61 per cent higher than stipulated prices. A higher percentage of small and marginal farmers are forced to buy urea from the black market, because large farmers are typically better connected and therefore able to secure subsidised urea. On average small and marginal farmers pay 17 per cent extra relative to large farmers, and in some states – Punjab, U.P., and Tamil Nadu – it goes up to 55-70 per cent extra. (Perversely, the Economic Survey uses this fact of official mismanagement and corruption to argue for the dismantling the fertiliser subsidy altogether, substituting it with cash transfers – and at the same time freeing urea prices. Such a policy would result urea prices spiraling in precisely the same way as potash and phosphates prices, accompanied by a sharp drop in fertiliser usage.) Official discussion of agriculture takes it for granted that commercialisation is beneficial to peasants. Indeed the Government’s strategy for agriculture explicitly aims to orient agriculture even further towards the market. However, it is striking that the peasant suicides since the late 1990s have been concentrated in the regions of greater commercialisation, and particularly among peasants growing commercial crops such as cotton. From data of the NSS Situation Assessment Survey of Farmers (2002-03) we can calculate the share of crop which is sold in different states, which is a measure of commercialisation.6 From the same survey, we can also obtain the percentage of farmers who are indebted in different states. Significantly, the higher the share of crop sold, the higher the indebtedness. And, as we noted earlier, this indebtedness has grown in the context of peasants’ inability to meet their consumption needs from farm income. In other words, greater market orientation, instead of improving the position of the cultivator and enabling him/her to carry out accumulation, is trapping him/her in debt.
In conclusion, (i) even in periods of relatively higher public investment, expanded agricultural credit and State intervention in agriculture, the agrarian crisis does not disappear, though it may moderate, and peasants may obtain some relief; (ii) as the neoliberal State withdraws from public investment in agriculture, various retrogressive exploitative elements re-assert themselves and tighten their grip on the peasant; and (iii) this process further weakens, even cripples, the development of productive forces and the emergence of dynamic class forces in agriculture.
Notes: 1. No doubt, an even larger percentage of farmer households were in deficit 10 years earlier i.e., in 2002-03, when the last such survey of farmers was conducted by the National Sample Survey (NSS). However, that was a drought year; by contrast, 2012-13 was a normal year. A qualification: The definition of ‘farmer’ in the 2002-03 Round is slightly different from that in 2012-13 Round. (back) 2. R. Ramakumar and Pallavi Chavan, “Bank Credit to Agriculture in India in the 2000s: Dissecting the Revival”, Review of Agrarian Studies, 2014. (back) 3. As mentioned in the article, the official data regarding indebtedness, particularly indebtedness to private sources, appear to be underestimates. For various reasons, respondents may not be revealing the full extent of their moneylender/trader debts. Otherwise, given the estimated cost of agricultural inputs, it would be difficult to understand how peasants are covering their current costs of cultivation. (back) 4. Aea under fruits rose 43 per cent from 5.05 million hectares (mh) in 2004-05 to 7.14 mh in 2013-14; area under fruits rose 23.4 per cent in the same period, from 6.74 mh to 8.32 mh. Deokar and Shetty, op. cit. (back) 5. Surinder Sud, “A silent horticulture ‘revolution’”, Business Standard, 15/3/2015. (back) 6. The same calculation cannot easily be carried out from the latest NSS survey of farmers (2012-13). (back)
NEXT: IV. Fairy Tales About Foreign Investment
|
|
| Home| About Us | Current Issue | Back Issues | Contact Us | |
|
|
All material © copyright 2017 by Research Unit for Political Economy |
|