What has been the actual impact of a decade (2014-24) of accelerated digitalisation on India’s economy? Let us look at the overall performance of the economy in terms of GDP; consumption; investment; the level and pattern of employment; and wages and incomes. Then let us turn to the growth of the digital economy versus the non-digital economy.
Overall economic performance in the period of peak digitalisation
Digitalisation was only one of many factors influenced the economy in this period, which also happens to coincide with the two terms of the Modi government. Thus the state of the economy in this period cannot be directly traced to digitalisation. Nevertheless, given the extravagant claims made by the proponents of digitalisation regarding its economic impact, it is legitimate to search for the contribution it has made to the country’s overall economic performance.
During the decade of peak digitalisation, India’s economy has deteriorated sharply, depressing the conditions of the vast majority of people, even as a small section of the population has prospered.
GDP Growth
The rulers frequently define development in terms of Gross Domestic Product (GDP), e.g., making India a $5 trillion economy by 2024, 2025, or 2028, and talk of India’s GDP being the world’s fifth largest economy now and third largest at some point in the future. Of course, this measure has little meaning; even if we leave aside for the moment the serious question of how meaningful GDP is as a measure of economic progress and human welfare, what matters is the GDP in per capita terms. India continues to rank very low among nations in per capita income – 136th by IMF data.1 It ranks just behind Sri Lanka, Lebanon, Egypt, and Nicaragua, and just above Ivory Coast, Uzbekistan, Bangladesh, Cambodia, Papua New Guinea, and the Congo, none of whom is staking a claim to global leadership.

Importantly, the distribution of that national income is so unequal that a person with an ‘average’ income earns more than nearly 90 per cent of the people.2
The measure of GDP itself is considerably obscured now by the present regime’s cavalier practices with regard to economic statistics, which have faced considerable criticism; one analysis found that growth in the new series of GDP statistics (introduced in 2015) is overstated by perhaps 2.5 percentage points.3 Even if we ignore those objections, there is another solid reason to doubt the current estimates. The authorities have wilfully failed to carry out surveys of the informal sector in recent years. Ignoring the fact that the informal sector has been badly battered in recent years by a series of Government decisions (e.g., demonetisation, GST), the authorities continue as before to extrapolate from formal sector data to produce inflated estimates of informal sector output; and thereby they overstate the GDP.4
Despite these serious reservations regarding the GDP data, let us look at growth in two periods, 2004-05 to 2013-14 and 2014-15 to 2023-24. GDP growth during the first period averaged 6.8 per cent, and in the second, 5.9 per cent.
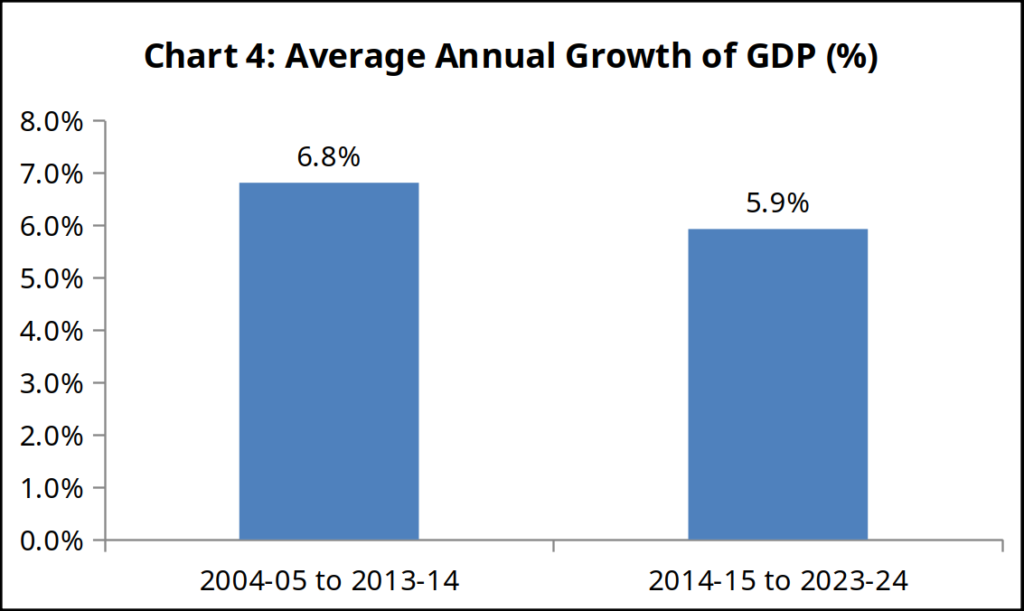
A caveat: the Covid-19 crisis took place in the latter period, providing a partial alibi for lower average growth. However, (1) the earlier period too had experienced the Global Financial Crisis of 2008, which had an impact on domestic growth; and (2) the contraction in India’s GDP during Covid – one of the steepest worldwide – was partly due to Government policy (it enforced one of the harshest lockdowns worldwide, on a largely informal economy, and carried out only meagre expenditure to counteract the effects of this). Thus the Government is partly responsible for the extent of economic contraction during the pandemic.
Alternatively, we can exclude the period of the pandemic and the subsequent recovery. We find that GDP growth rates over the course of the pre-Covid period fell steeply, from 7.4 per cent in 2014-15 to just 3.9 per cent in 2019-20. Well before the advent of Covid, there were sharp declines in industrial growth, capacity utilisation in industry, construction activity, the consumption growth of fast-moving consumer goods, and real wages of rural labour. The economy was thus already in a severe crisis before Covid. After the lockdown was lifted, there was an apparent spurt in growth due to the ‘base effect’ (i.e., growth on a low base); thereafter, however, growth is again slowing down.
Depressed consumption, collapse of investment
Nilekani celebrates the fact that “In 2016, India used mostly cash. In 6 years, India became the highest volume of digital payments.”5 However, cash and digital payments are simply two different technologies for making payments. While one or the other may be convenient for particular purposes, the amount people spend is not basically determined by the mode of payment, but by their purchasing power, which is determined by their income, their employment. In a period of economic stress and uncertainty, people take care to spend less, irrespective of the mode of payment.
The Finance Ministry claims, in its review of 2023-24, that “Digitalisation directly helped to increase private consumption, both during the pre and post-pandemic phases.”6 In fact, consumer demand has been on a downward trend during the last decade. This can be seen in the index of industrial production (IIP) for consumer goods, both non-durables (largely items of mass consumption) and durables.7
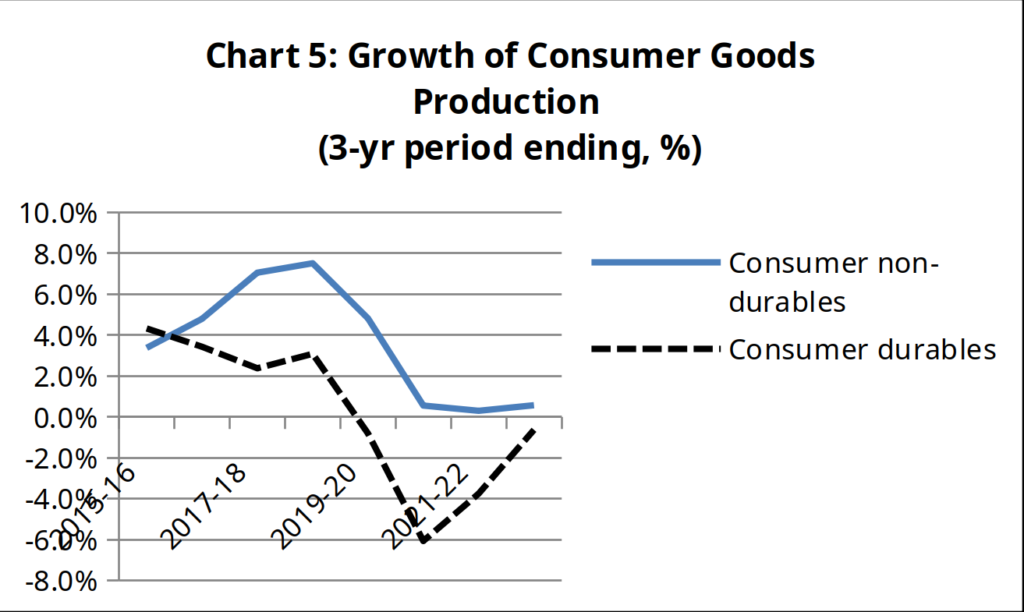
Nielsen data show that demand for the corporate fast-moving consumer goods (FMCG) sector stalled in 2019, with volumes consumed remaining flat or even shrinking outright thereafter.8 Given that population has continued to rise, this indicates that consumption per capita shrank – a hypothesis which fits with the data regarding incomes, which we will come to later.
The paucity of demand has resulted in stagnant levels of capacity utilisation in industry, showing hardly any change over a decade.
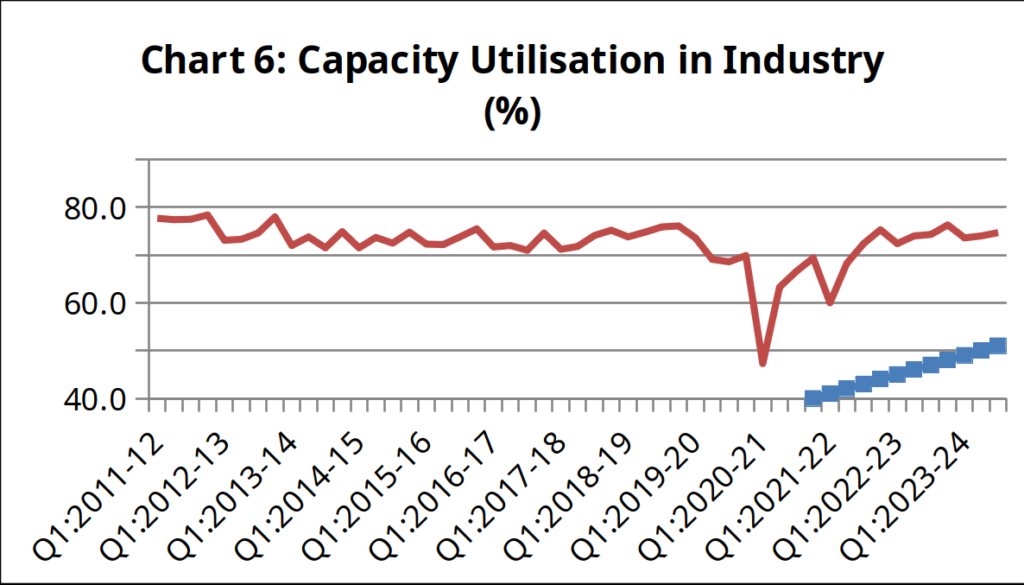
Given that private capitalists face inadequate demand with existing levels of capacity, they are reluctant to set up new capacity. Investment, already on a downward path since 2011, has continued to fall during the period of peak digitalisation.
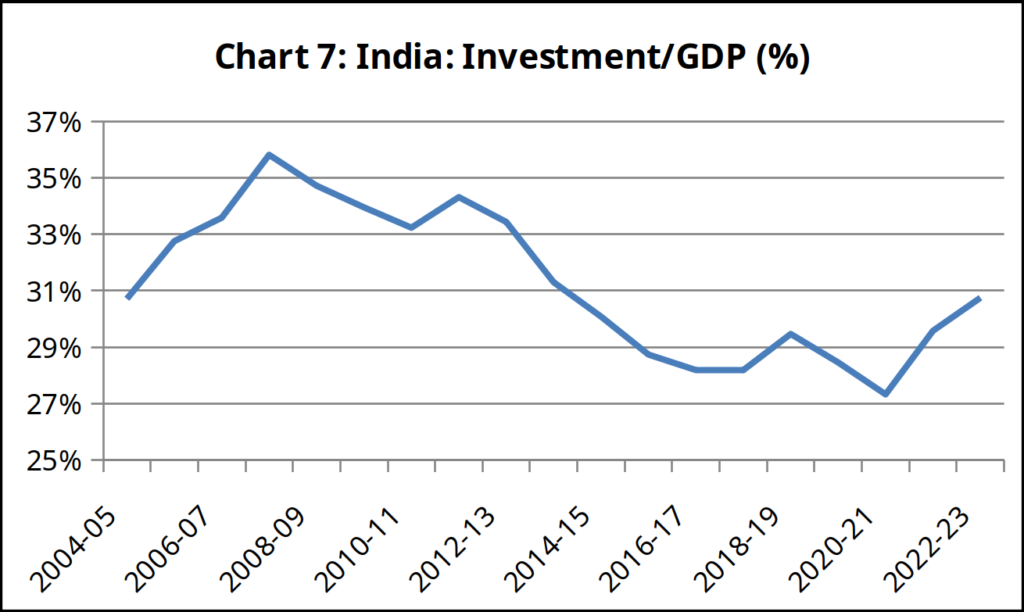
The index of industrial production for investment goods such as plant and machinery has stayed flat for more than a decade. Earlier, the standard explanation for the collapse of private investment, retailed in the official Economic Survey and elsewhere, was that the corporate sector was reluctant to borrow because of its existing bad debts, and the banking sector was reluctant to lend because of its existing bad loans. However, in the last few years, both of these have been largely cleared up, yet the corporate sector is still not borrowing – bank credit outstanding to large industry in February 2024 is roughly 15 per cent less in real terms than it was in March 2023.9
The Finance Minister has repeatedly, and with increasing exasperation, called upon private industry to step up capital expenditure,10 but with little effect. The present Chief Economic Advisor has rebuked the corporate sector for waiting for demand to emerge: “what is holding it [corporate investment] back? It is easy to say there is general demand uncertainty…. this decade is going to be the decade of uncertainty, whether we like it or not.”11 The RBI recently told the corporate sector that it “must get its act together ready to relieve the government of capex heavy lifting”.12 Instead, there are indications that corporate investment slowed further over the course of 2023.13
Is India “upgrading” to a “formal, high productivity economy”?
How people are employed
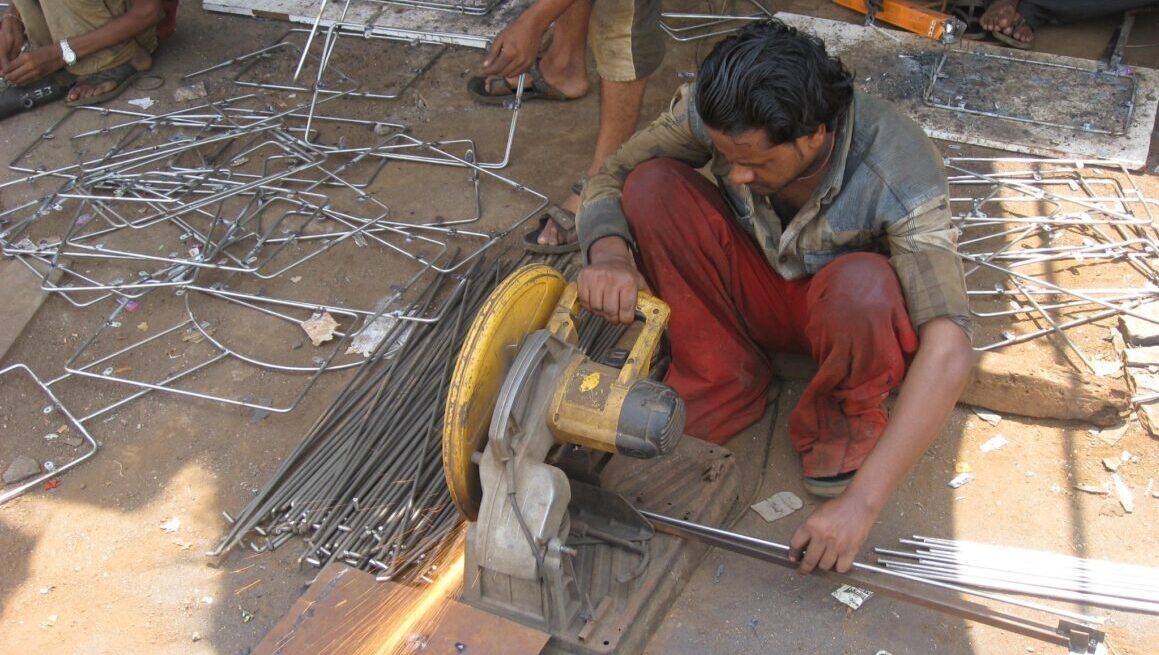
Nilekani claims that “India is upgrading” from an “informal, low productivity economy” to a “formal, high productivity economy.” Similarly, the IMF paper claims that digitalisation could improve India’s productivity in the medium and long term.14 These claims are not restricted to a specific sector, but concern the economy as a whole: We are told that the Digital India programme aims to transform India into a ‘knowledge economy’.
While these claims are false, they do focus on the relevant question, namely, the nature of employment. Indeed, the crux of development is not whether the GDP is x or y figure, but how productively the country’s working people are employed, what goods/services they are producing, and on what terms. The relevant data are analysed and presented in the recent India Employment Report 2024.15
In looking at employment trends, we need to keep in mind certain points. Persons engaged in any ‘economic activity’ are considered employed; in fact, even unpaid household members who assist in a household farm or non-farm activities too are considered employed. A person who, for lack of better work, becomes a street vendor, is considered ‘self-employed’. The definition of unemployment is restricted to those actively seeking work, but unable to obtain it. Those who do not actively seek employment in economic activities, on the other hand, are considered outside the labour force, and therefore not counted among the unemployed.
From the above it is clear that ‘employment’ can even rise under conditions of greater distress, since people may be driven to take up any work on offer, or to pitch in on the family farm or business, to add a few rupees to the household income. It is important to look at not just the figure of total employment, but its terms. We need to check whether workers are shifting from farms to factories (or other such high-productivity employment).
Table 1 below provides a reality check. Agriculture still bulks the largest among the sectors of employment (246.5 million); it is followed by construction (67.9 million), a sweated sector considered low-skill.16 The predominantly low-skill sectors of trade, hotels and restaurants (66.3 million) and transport, storage and communications (30.6 million) account for the bulk of services employment.
Finance, business and real estate, public administration and defence, and education and health are considered more skilled; in these sectors 42-45 per cent of jobs require medium to high skill. However, these sectors account for less than 9 per cent of total employment.
| Table 1: Sectoral Distribution of Employment, 2022 | |
| Sector | Mn. Workers |
| Agriculture, forestry & fishing | 246.5 |
| Mining & quarrying | 1.8 |
| Manufacturing (organised & unorganised) | 63.2 |
| Electricity, gas, water supply & other utilities | 3 |
| Construction | 67.9 |
| Services: | |
| Trade | 56.8 |
| Hotels & restaurants | 9.5 |
| Transport & storage | 22.7 |
| Postal & courier activities | 0.9 |
| Information & communication services | 7 |
| Financial services | 5.6 |
| Business services | 10.6 |
| Public administration & defence | 8.3 |
| Education & health | 22.9 |
| Other services | 17.7 |
| Total | 544.5 |
During 2000-19, according to official statistics, the economy was growing rapidly. Yet during 2000-12, employment grew at just 1.6 per cent a year. In the next phase, 2012-19, employment growth stopped altogether (0 per cent). Then, in a sudden turnabout, during a period of great calamity and distress, 2019-22, when economic growth slumped to half the earlier rate, employment surged to 5.3 per cent per year.
| Table 2: Growth Rate of Employment Across Sectors and Gross Value Added (%) | |||
| 2000-12 | 2012-19 | 2019-22 | |
| Total Employment | 1.6 | 0.0 | 5.3 |
| Employment in Agriculture | -0.4 | -2.6 | 8.9 |
| Employment in Manufacturing | 2.9 | -0.3 | 3 |
| Employment in Construction | 9.2 | 2.2 | 6.4 |
| Employment in Services | -0.7 | 10.8 | 1.1 |
| Gross value added | 6.2 | 6.7 | 2.7 |
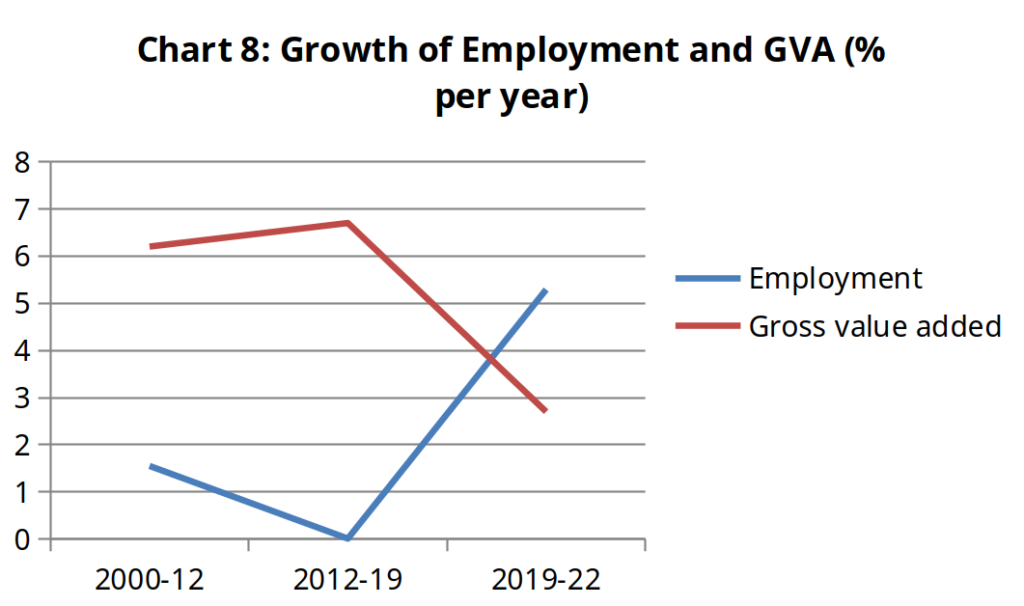
Even stranger was the source of the employment growth. As we can see from the Table above, during 2012-19 construction employment slowed, and manufacturing employment slightly declined. Then, during 2019-22, there was a reverse flow of workers to agriculture. Much of this was the result of the nationwide Covid lockdown, which drove workers back to their villages; but the level of agricultural employment has remained elevated even after the lifting of the lockdown, indicating the persisting lack of jobs outside agriculture.
One of the standard markers of ‘development’ is a decline in the share of self-employment. As societies develop, self-employed peasants, artisans and other petty producers shift to wage employment, working for capitalists.
In India, however, self-employment has remained the principal form of employment. Indeed, it has risen from about 52 per cent during 2000-19 to 55.8 per cent during 2019-22. Nearly two-thirds of the overall increase in employment after 2019 was of self-employed workers, mainly unpaid (women) family workers. Rather than a genuine growth in employment, this reflected an attempt by households in distress to enlist all members of the household in bringing in some income. Since most women would already have been fully occupied with household duties, this would have constituted an additional burden, rather than an improvement in their condition. In India, the ‘informal’ or ‘unorganised’ sector accounts for at least 81.1 per cent of employment, and perhaps more. ‘Regular’ wage employment accounts for the remaining 18.9 per cent. Of the ‘regular’ employment, the majority consists of informal jobs – without a written agreement, paid leave, or social security. The percentage of workers with formal jobs has increased by just 1.2 percentage points between 2000 and 2022, from 8.5 per cent to 9.7 per cent. Even among the minority who have written contracts, the contracts are increasingly short-term – hardly one in four has a contract of three years or more.
Wage and income levels in the last decade
A number of sources show that real wage levels (i.e., after discounting for inflation) have stagnated or outright fallen in recent years. The India Employment Report 2024 calculates, on the basis of official sample survey data, that real earnings for salaried workers and self-employed individuals declined over the last decade; these account in 2022 for more than three out of four workers.[mfn]International Labour Organization and Institute for Human Development, India Employment Report 2024, youth employment, education and skills (Geneva: International Labour Office, 2024). [/mfn] The following figures are expressed in 2012 rupees, in order to discount for inflation.
— The average monthly real earnings for regular salaried workers declined annually by 1.2 per cent, from Rs 12,100 in 2012 to Rs 11,155 in 2019, and by 0.7 per cent as of 2022, to Rs 10,925.
— Similarly, the average real earnings of self-employed individuals declined annually by 0.8 per cent, from Rs 7,017 in 2019 to Rs 6,843 in 2022.
— Casual workers alone saw a rise in their real wages, but the increase was small, and on an abysmally low base. The average real monthly earnings of casual workers increased by 2.4 per cent annually, from Rs 3,701 in 2012 to Rs 4,364 in 2019, and by 2.6 per cent annually, to Rs 4,712 in 2022. In nominal rupees, their monthly wages in 2022 were just Rs 8,267.
In the period since 2014-15, Labour Bureau data show that real rural wages in both agriculture and non-agriculture have not risen. Significantly, in the period since 2018, rural wages have declined in real terms. Given that rural labour are the lowest income group in the country, a further decline in their wages is a silent calamity.
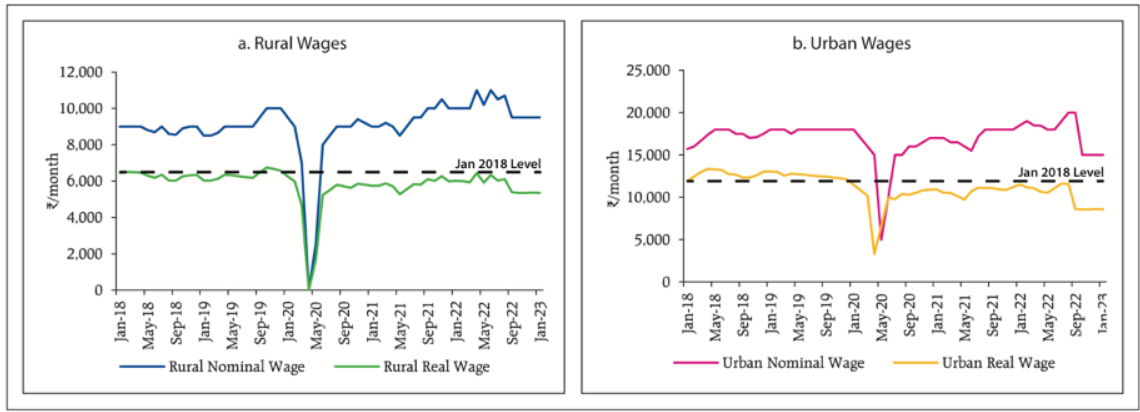
Even official documents of the Finance Ministry and the RBI confess a broad-based decline in real wages.17 For example, using data of the Centre for Monitoring the Indian Economy (CMIE), the RBI showed that real wages in both rural and urban areas had declined between January 2018 and January 2023 (see Chart 9).
Chart 9: Rural and Urban Real Wages, 2018-23
The incomes of the peasantry too have been depressed. Between 2012-13 and 2018-19, as revealed by National Sample Surveys of farmers, real income from farming of crops fell by 8.7 per cent for the average farm household.18 The terms of trade for farmers, as we shall see later, have remained depressed after 2011. The depressed incomes of both peasants and agricultural workers are reflected in the depressed sales of mass consumption goods: the sales volumes of FMCG companies have been particularly low in rural areas. Although there are now signs of a recovery, the recovery is after a period of negative growth.
The RBI carries out Surveys of Consumer Confidence every two months. Those surveyed express whether, in respect of employment, prices, income, spending (essential and non-essential), and the general economic situation, they are better off or worse off than a year earlier, or the same. The positive responses are netted out against the negative responses, and an index is constructed out of all these responses. After March 2019, i.e. a year before the Covid lockdown, the index has been continuously negative. Even in the latest survey, large majorities find the situation with regard to each of the above subjects either no better than, or worse than, a year previous. In the latest survey, of March 2024, 85 per cent said that spending on ‘essential’ items had increased over the previous year, and 71 per cent said that spending on ‘non-essential’ items had remained the same or decreased.19 With falling real incomes, there are indications that households are running into debt for their routine household expenditures. Indian households’ net financial savings fell to a 47-year low as a percentage of GDP in 2022-23, mainly on account of higher borrowings by households. Household debt to GDP rose to about 40 per cent of GDP by December 2023, a new high. The fastest-growing component of this is unsecured personal loans.20
A policy of demand depression
The paucity of demand has been a long-term underlying problem of the Indian economy, much predating digitalisation. Without radical restructuring of property relations, it cannot be basically overcome, even though there may be temporary spurts of growth, such as the 2003-11 ‘boom’. The period since 2011 has been one of stagnation, in the main, due to this underlying feature. However, the neoliberal policy of the Government to reduce its expenditure has worsened the depression. As it does so, it keeps reiterating its tenet that digitalisation is laying the foundations for rapid growth in future. The Finance Ministry says in its review of the economy for 2023-24:
Besides the structural reforms across various sectors, the government’s emphasis ondeveloping public digital infrastructure during the last few years has also been a game changer in enhancing the economic potential of individuals and businesses.21
Private consumption is one of the four components of demand in the economy; the others are Government consumption, investment, and net exports. As we have seen above, private consumption is depressed; as a result investment is depressed. Export demand has been sluggish and unstable for a considerable time due to the state of the world economy and international conflicts. Of the four components, only Government spending is in the hands of the Government. In these circumstances, a standard policy prescription is for the Government to stimulate demand by increasing its expenditures. This acquires added urgency after the ‘scarring’ caused by the Covid lockdown, as a result of which a large section of people took, and are perhaps still taking, loans for essential consumption.
To the contrary, the Central Government has steadily brought down its expenditure as a percentage of GDP, from 17.7 per cent in 2020-21 to 14.9 per cent in 2023-24. (Further contraction is budgeted for 2024-25 and planned for 2025-26.) While the state governments have tried to keep up their spending/GDP ratio, this has not compensated for the fall in the Centre’s spending.22 In other words, in a period of depressed demand, the Central government has pursued a course of ‘fiscal consolidation’ (i.e., reduction of Government borrowing, generally by reducing expenditure), thus depressing demand even further.
In its latest consultation with the Indian government, the IMF pressed for yet further cuts to Government spending (it “recommended ambitious medium-term consolidation efforts” and “structural reforms”).23 The international credit rating agency Standard and Poor said in December 2023 that India’s credit rating would not be upgraded unless it cut its fiscal deficit further. In fact, the January 2024 Interim Budget revealed that the Government had managed bring down its fiscal deficit by Rs 52,000 crore more than it had budgeted for in 2023-24, and it budgeted for a further steep reduction in 2024-25.
What explains this policy of demand depression? The answer lies in India’s domination by international capital, particularly by international finance. India’s external liabilities – what is owned by foreigners, in foreign direct investment, foreign portfolio investment in the share market and bond market, and foreign loans – are officially put at $1.34 trillion, a gross underestimate, since these reflect the historical values at which the investment entered, not their present market value. (India’s foreign assets, by contrast, are worth $974 billion, largely invested in low-return debt in the US and other developed countries.) A sizeable share of these foreign liabilities can be withdrawn at short notice by foreign investors if they disapprove of India’s policies, including the scale and pattern of Government spending. That is why the Indian government strains to please international credit ratings agencies and the IMF; it also spends a great deal of energy in complaining that the agencies’ ratings are unfair.
The Indian government has recently taken a major step by opening Indian government bonds to investment by foreign investors. The American financial giant JP Morgan has recently added Indian government bonds to its index, a development widely advertised by Modi government functionaries such as Nirmala Sitharaman and V. Anantha Nageswaran as an achievement. (We have written about this on several occasions in the last four years, most recently here: https://rupeindia.wordpress.com/2023/10/07/who-loses-who-gains/ .) Two Turkish economists have aptly called this “Exposing India’s financial markets to vultures”.24
Foreign investors are opposed to an increase in the overall level of Government spending, for several reasons. One reason is that when Government spending is placed in a straitjacket, the Government makes larger concessions to private big capital and foreign investors in order to persuade them to invest. The Government also undertakes privatisations in order to garner some funds for its budget, and such privatisations are generally carried out at distress prices. Such a regime provides rich pickings for international capital.
In this actual regime of the domination by international capital, digitalisation provides a ‘narrative’ to justify fiscal cuts and privatisations amid a depression of demand.
Growing disarticulation
An RBI study25 estimates the size of India’s digital economy, its growth vis-a-vis the growth of the economy as a whole during 2014-19, and the employment in the digital sector. It defines the digital economy as “the contribution of economic transactions that involve both digital products and digital industries to Gross Domestic Product (or Gross Value Added, GVA). Digital products are the goods and services that primarily generate, process, and/or store digitised data. Digital industries are producers that primarily produce such products.”
The study finds that the digital economy more than doubled between 2014 and 2019, growing from $108 billion to $223 billion, whereas the economy as a whole grew much more slowly, from $1.99 trillion to $2.62 trillion. Thus the digital economy grew at a compound annual growth rate (CAGR) of 15.6 per cent, whereas the rest of the economy grew at a CAGR of 4.9 per cent – less than one-third the rate.
Interestingly, despite the increasing digitalisation of the economy described earlier, the digital sector is not getting further integrated with the rest of the economy. Rather, it is developing as an enclave, disarticulated from the rest of the economy. The gap between the growth of the digital sector and the non-digital sector is widening, and the digital industry is increasingly tied to the international economy:
— The digital hardware industry of computer, electronics, and optical products contributes only 0.1 per cent of the value added in India’s economy. The output response of the digital hardware industry to a $1 increase in demand (the output multiplier) declined between 2014 and 2019, indicating an increase in dependence on imported inputs. This despite a much-publicised Government campaign for ‘Make in India’, i.e., local manufacturing.
— The response of digital industry value-added to a $1 increase in demand (the value-added multiplier) fell for all sectors of the digital industry between 2014 and 2019. This indicates that the entire domestic digital sector is increasingly vertically integrated with the international economy. Correspondingly, it is less and less integrated with the rest of the domestic economy.
— Despite accounting for 8.5 per cent of the economy (Gross Value Added, or GVA), the core digital sector accounted for 0.92 per cent of total employed workers in 2019-20, or about 4.9 million people.
— Many celebratory writings about the growth of the digital economy conflate the ‘digital sector’ with the ‘digitally disrupted sectors’. However, there is a crucial difference. The latter consist of economic activities which are forced to radically change their method of operation as a result of digital ‘innovations’. These sectors thus experience the impact of the digital sector, without necessarily gaining additional income in the course of this. (For example, if a teacher is replaced by an app, the owner of the app may profit, but the total income of the education sector may shrink.) The digitally disrupted sectors employ around 57 million workers, or nearly 12 times as many as the core digital sector. The fate of these workers, in sectors such as transport, education, food and beverage serving, is uncertain. The RBI study says that “The extent of employed workers exposed to digital disruption underscores the need for digital literacy and skilling;” but will there be digital sector jobs for a large influx of displaced workers, even if they are made digitally literate and re-skilled?
- https://en.wikipedia.org/wiki/List_of_countries_by_GDP_(nominal)_per_capita , accessed April 30, 2024. ↩︎
- The threshold for the top 10 per cent of incomes of adult Indians is Rs 2.91 lakh; the average income of all adults is Rs 2.35 lakh. Nitin Kumar Bharti, Lucas Chancel, Thomas Piketty and Anmol Somanchi, “Income and Wealth Inequality in India, 1922-2023: The Rise of the Billionaire Raj”, World Inequality Lab, March 2024. ↩︎
- Officially, India is currently said to be growing at 7.6 per cent per year, the fastest growing major economy in the world. However, the new series of GDP, introduced in 2015, appears to be out of sync with other economic indicators. When the new series of GDP was introduced in 2015, reservations were expressed by the RBI itself (Ishan Bakshi, Arup Roychoudhury, “Statistics ministry rebuts RBI’s doubts over new GDP series”, Business Standard, May 2, 2015), and the Government’s own Economic Survey 2016-17, vol. 2, p. 27., indirectly questioned the credibility of the new series. The new series’ methodology has been questioned on various grounds by different economists; see, for example, Arvind Subramanian, “India’s GDP Mis-estimation: Likelihood, Magnitudes, Mechanisms and Implications”, Center for International Development, Harvard, June 2019. ↩︎
- See article by Arun Kumar in the present issue, and the following interview: “Data on Which GDP Calculated A Major Concern, Soon GDP Could Become Unreliable: Pronab Sen”, November 21, 2023, https://thewire.in/video/watch-karan-thapar-pronab-sen-gdp-figure-concern ↩︎
- Nandan Nilekani, “India’s digital transformation”, Powerpoint presentation, Slide 5, 2023.https://drive.google.com/file/d/1UK_uvDvLqyELtXAJQA3uRSLDmNjHkxP9/view ↩︎
- Department of Economic Affairs, Ministry of Finance, The Indian Economy – A Review, January 2024, p. 18. ↩︎
- The spike in consumer non-durables in 2017-18 may not reflect a rise in overall demand, but a shift from small units to large units. The IIP is based on production data of larger units; in 2017-18, the introduction of GST drove many small producers of non-durables out the market, leading to an expansion of the market for large units.Ajita Shashidhar “How large consumer goods companies benefitted due to GST, e-commerce in 2018”, Business Today, December 26, 2018. ↩︎
- See successive Hindustan Unilever quarterly presentations, https://www.hul.co.in/investor-relations/results-presentations/quarterly-results/ ↩︎
- Bank credit outstanding to large industry, RBI, Sectoral Deployment of Non-Food Gross Bank Credit; deflated using GDP deflators for 2013-14 and 2023-24. ↩︎
- “FM Nirmala Sitharaman Invites India Inc To Invest In New-Age Sectors To Push Growth”, February 5, 2022, https://news.abplive.com/business/fm-nirmala-sitharaman-invites-india-inc-to-invest-in-new-age-sectors-to-push-growth-1511087, Gireesh Chandra Prasad, “What is stopping you from investing, FM asks India Inc”, September 14, 2022, “Govt has made policies to make India attractive for investment: Nirmala Sitharaman”, Hindustan Times, April 20, 2024. ↩︎
- Shiva Rajora, “CEA V. Anantha Nageswaran urges India Inc to step up investments”, Business Standard, December 7, 2023. ↩︎
- “State of the Economy”, RBI Bulletin, February 2024. ↩︎
- “India Inc delays investment decisions amid uncertainty”, Policy Circle, December 11, 2023. https://www.policycircle.org/economy/india-inc-delays-investments/ ↩︎
- Cristian Alonso, Tanuj Bhojwani, Emine Hanedar, Dinar Prihardini, Gerardo Una and Kateryna Zhabska Stacking up the Benefits: Lessons from India’s Digital Journey, International Monetary Fund Working Paper, 2023, p. 5. ↩︎
- International Labour Organization and Institute for Human Development, India Employment Report 2024: Youth employment, education and skills, 2024. ↩︎
- Skill levels here refer to formal training and education; the knowledge and skill required for agriculture or construction labour, though considerable, are not taken into account. ↩︎
- The Economic Survey 2022-23 admitted that Labour Bureau data showed that “growth in real rural wages has been negative”. The latest RBI Monetary Policy Report (April 2024) shows that this trend continues through 2023-24. ↩︎
- RUPE, “The Rural Depression”, Aspects of India’s Economy no. 78, https://rupe-india.org/aspects-no-78/the-rural-depression/ ↩︎
- RBI, Consumer Confidence Survey, March 2024. “Essential items comprise of food, housing, fuel & electricity, essential clothing, education, medical amenities, transportation etc. Non-essential items comprise of consumer durables, motor vehicles, gold & jewelry, expenses on hotel & restaurant etc.” ↩︎
- Motilal Oswal Financial Services, “HHNFS likely unchanged at ~5% of GDP in 9MFY24”, EcoScope, March 19, 2024. https://www.motilaloswal.com/site/rreports/HTML/638465220142945892/index.htm ↩︎
- Department of Economic Affairs, op. cit., p. 18. ↩︎
- Disbursements by state governments rose from 18.7 per cent of GDP in 2020-21 to 19.2 per cent in 2023-24, but the combined disbursements of Centre and states fell from 32.1 per cent of GDP to 30 per cent in the same period. Calculated from RBI Database. ↩︎
- IMF, Staff Report for the 2023 Article IV Consultation, November 2023. ↩︎
- Yilmaz Akyuz and T. Sabri Oncu, “Exposing India’s financial markets to vultures”, The Hindu, February 2, 2024. ↩︎
- Dhirendra Gajbhiye, Rashika Arora, Arham Nahar, Rigzen Yangdol, and Ishu Thakur, “Measuring India’s Digital Economy”, RBI Bulletin, December 2022. ↩︎